2025-26 College Basketball Rankings & Ratings For All 365 Teams
We have our full rankings for the start of the 2025-2026 college basketball season, plus a breakdown of our Top 25 rated teams.
by Jason Lisk - Oct 30, 2025
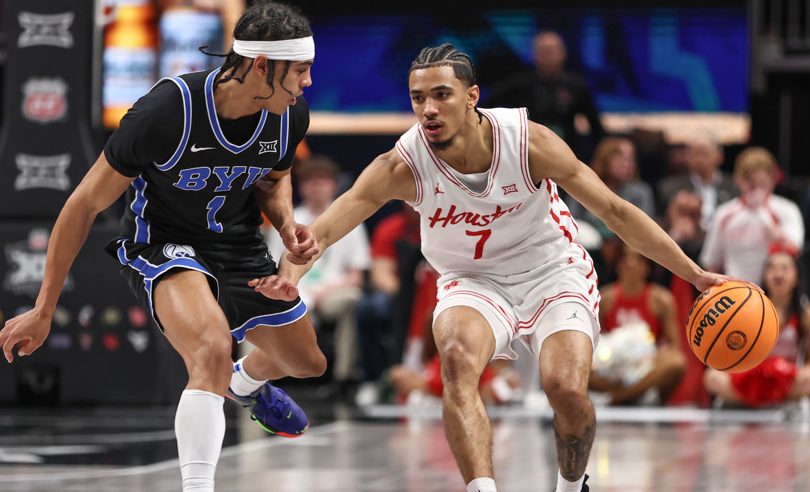
Milos Uzan and Houston sit atop our rankings to start the year (Scott Winters/Icon Sportswire)
Our 2025–26 college basketball rankings are live, just in time for opening night on Monday, November 3, 2025.
If you want the nuts and bolts of our process, see our TeamRankings explainer on how we build college basketball preseason ratings.
And yes, debate is part of the fun, but historically, our preseason models have ranked among the most accurate. If you’d rather skip straight to the numbers, jump to the data below.
Here’s what you’ll find:
- Highlights from this year’s preseason rankings
- The complete rankings and ratings for all 365 Division I teams
- The key factors that drove each team’s preseason rating
But first things first, the question that’s on everyone’s mind: who’s No. 1?
Houston at No. 1: Veteran Core Plus Talented Newcomers
Houston, for the second year in a row, stands atop our college basketball rankings heading into the year. Last season, the Cougars earned a No. 1 seed, knocked off Duke in the Final Four, and lost a close game after having a lead in the national title. Relative to Florida, though, Houston has more pieces coming back in 2025-2026.
Houston did lose forward J’Wan Roberts, but Joseph Tugler, already one of the best rebounders and interior defenders in college basketball, should be primed to take on an even bigger role this year. The backcourt of Milos Uzan and Emanuel Sharp returns.
And to that core, Houston is adding one of the best freshman classes in the country, to a situation where they don’t have to start out as the stars, but can contribute to a winning team with established success. Forward Chris Cenac and guards Kingston Flemings and Isiah Harwell are all top 20 national recruits who could provide this team with a boost as the season goes on.
Of course, there’s head coach Kelvin Sampson, who just keeps getting better with age. Houston’s last time finishing outside our Top 4 in end-of-season power ratings was the 2019-2020 season. We’ll bank on that consistent success carrying forward another year.
Where is Last Year’s Champion, Florida?
Florida is ranked No. 5 in our initial rankings, and it will certainly be in the mix to compete for a national title again.
The Florida front court is back and deep. All of the key players on the front line (Alex Condon, Thomas Haugh, Rueben Chinyelu, and Micah Handgloten) are back. The question marks come in the backcourt, where they will be relying on a lot of players new to the program. Gone are All-American Walter Clayton, along with Alijah Martin and Will Richard.
Boogie Fland, who was inconsistent as a freshman at Arkansas last year, has transferred in. The team has also added Xaivian Lee, a guard who has been Princeton’s leading scorer the last two seasons. Two key freshmen, C.J. Ingram and Alex Lloyd, could also play a role.
How quickly the backcourt can come together may decide whether Florida is going to be “pretty good” or compete for a top seed again.
Pretty Balanced Across the Top Conferences
Our top five features teams from five different conferences, and the distribution across the top 25 is also pretty balanced among the top conferences.
Our Top 25 features seven teams from the Big 12, six from each of the Big Ten and SEC, and then six others (3 Big East, 2 ACC, and Gonzaga).
Outside of the Power Five Conferences, though, you have to go fairly far down the list past Gonzaga to find the next tier of teams.
The other top-rated teams (besides Gonzaga) from outside the ACC/Big East/Big Ten/Big 12/SEC are:
- San Diego State, No. 47
- VCU, No. 50
- Utah State, No. 51
- Boise State, No. 53
- Saint Mary’s, No. 55
- Memphis, No. 64
NCAAB Preseason Top 25 Comparison
Let’s run through our complete 2025–26 college basketball Top 25.
We included every team that landed in at least one preseason Top 25 from these sources:
- TeamRankings preseason ratings (TR)
- Ken Pomeroy’s preseason ratings (KP)
- Bart Torvik’s preseason ratings (BT)
- AP Poll (AP)
- Coaches’ Poll (COACH)
The table below lists each team’s rank in those five systems, the average of those ranks, and a final column showing TR’s difference from the consensus average. A positive value means TR rates the team higher than consensus; a negative value means lower than consensus.
Teams that received no poll votes were assigned a rank of 55. Teams are sorted by lowest (best) average rank. All rankings are as of October 30.
Teams With At Least One Top 25 Preseason Ranking
| Team | TR | KP | BT | AP | COACH | AVG | TR DIFF |
|---|---|---|---|---|---|---|---|
| Houston | 1 | 1 | 1 | 2 | 2 | 1.4 | 0.4 |
| Purdue | 2 | 3 | 4 | 1 | 1 | 2.2 | 0.2 |
| Florida | 5 | 2 | 5 | 3 | 3 | 3.6 | -1.4 |
| Duke | 3 | 7 | 2 | 6 | 5 | 4.6 | 1.6 |
| UConn | 4 | 5 | 10 | 4 | 4 | 5.4 | 1.4 |
| Michigan | 7 | 11 | 3 | 7 | 7 | 7.0 | 0.0 |
| Kentucky | 6 | 4 | 14 | 9 | 9 | 8.4 | 2.4 |
| St John's | 8 | 16 | 7 | 5 | 6 | 8.4 | 0.4 |
| UCLA | 9 | 10 | 9 | 12 | 12 | 10.4 | 1.4 |
| Illinois | 10 | 6 | 8 | 17 | 14 | 11.0 | 1.0 |
| BYU | 17 | 18 | 6 | 8 | 8 | 11.4 | -5.6 |
| Louisville | 16 | 14 | 11 | 11 | 10 | 12.4 | -3.6 |
| Arizona | 12 | 15 | 12 | 13 | 13 | 13.0 | 1.0 |
| Tennessee | 11 | 9 | 13 | 18 | 17 | 13.6 | 2.6 |
| Texas Tech | 14 | 12 | 29 | 10 | 11 | 15.2 | 1.2 |
| Iowa St | 18 | 13 | 15 | 16 | 18 | 16.0 | -2.0 |
| Kansas | 13 | 21 | 17 | 19 | 19 | 17.8 | 4.8 |
| Alabama | 15 | 23 | 20 | 15 | 16 | 17.8 | 2.8 |
| Gonzaga | 19 | 8 | 24 | 21 | 20 | 18.4 | -0.6 |
| Arkansas | 23 | 29 | 16 | 14 | 15 | 19.4 | -3.6 |
| Michigan St | 21 | 25 | 22 | 22 | 21 | 22.2 | 1.2 |
| Auburn | 22 | 31 | 28 | 20 | 22 | 24.6 | 2.6 |
| Ohio St | 20 | 27 | 19 | 30 | 28 | 24.8 | 4.8 |
| North Carolina | 27 | 33 | 18 | 25 | 25 | 25.6 | -1.4 |
| Wisconsin | 30 | 20 | 30 | 24 | 24 | 25.6 | -4.4 |
| Creighton | 25 | 41 | 23 | 23 | 23 | 27.0 | 2.0 |
| Vanderbilt | 31 | 19 | 21 | 36 | 32 | 27.8 | -3.2 |
| USC | 34 | 22 | 26 | 33 | 33 | 29.6 | -4.4 |
| Baylor | 24 | 17 | 36 | 42 | 30 | 29.8 | 5.8 |
| Missouri | 28 | 28 | 25 | 34 | 35 | 30.0 | 2.0 |
| Mississippi | 37 | 24 | 43 | 32 | 36 | 34.4 | -2.6 |
College Basketball Rankings: Top 25 Comparisons
When comparing college basketball rankings across the systems above, a couple of things stand out.
Teams Rated Higher by Human Polls
Last year, the teams favored more heavily by the human polls were general disappointments. Only Mississippi performed up to the poll expectations (a No. 6 seed as preseason No. 25), while Kansas, Baylor, and Arkansas all went from highly ranked in the preseason to middling seeds in the tournament, and Indiana just missed the field.
This year, there’s a little more agreement between the polls and the data-driven rankings, and also some more diversity in the data-driven rankings, which leads to fewer clear discrepancies.
Below are teams ranked higher in both the preseason AP and Coaches Polls than in any of the three leading data-driven systems (TeamRankings, Pomeroy, Torvik).
Listed are the teams with the largest discrepancies, along with the difference between (a) their lowest human poll ranking and (b) their highest ranking among the data-driven systems.
- St. John’s +1 (No. 6 in Coaches Poll, No. 7 in BT)
- Texas Tech +1 (No. 11 in Coaches Poll, No. 12 in KP)
- Arkansas +1 (No. 15 in Coaches Poll, No. 16 in BT)
- Purdue +1 (No. 1 in both polls, No. 2 in all of KP, TR, BT)
These barely qualify as disagreements, as Purdue is not seen as the top team in the data-driven systems but is close, and all the others are also near at least one of the data-driven rankings.
Teams Rated Lower by Human Polls
Last year, the data-driven rankings prevailed in the showdown with the human polls. Houston, Duke, and Auburn all finished as No. 1 seeds and were closer to their data-driven ratings in the preseason by the time the season ended.
The only other team to make the list was Texas Tech, which was just outside the Top 25 in the preseason but inside it in all the ratings systems and finished as a No. 3 seed.
Now to this year’s versions, as there are more disagreements here, and teams that are a little lower in the human polls.
The teams below are ranked lower in the preseason AP and Coaches Polls than in any of the data-driven rankings systems.
Listed is the difference between (a) each team’s highest ranking in the human polls and (b) its lowest ranking among the three data-driven systems.
- Missouri -6 (No. 34 in AP Poll in votes, No. 28 in TR and KP)
- Tennessee -4 (No. 17 in Coaches Poll, No. 13 in BT)
- Illinois -4 (No. 14 in Coaches Poll, No. 10 in TR)
- UCLA -2 (No. 12 in both polls, No. 10 in KP)
Missouri only made the Top 25 in Bart Torvik’s ratings, but is just outside in ours and Pomeroys, and lower down the list of votes received by the polls. The voters do not have as much belief that Tennessee will stay as a top team, while Illinois and UCLA appear in the Top 10 in all three rankings systems, but outside it in the polls.
Who’s Most In Sync With Consensus?
Among the 31 teams listed in the table above, the Coaches Poll is actually closest to consensus this year, just ahead of TeamRankings, while Torvik is the only one that has a lower correlation to consensus this year compared to last.
The rank order of correlation to consensus is as follows:
- Coaches Poll (0.970)
- TeamRankings (0.958)
- AP Poll (0.936)
- Pomeroy (0.886)
- Torvik (0.793)
Compared to the other ranking systems, our rankings tend to have fewer or smaller outliers. This makes sense, as we incorporate market and poll data to adjust for cases where our model rating alone appears as a significant outlier.
Teams We Rate Higher (Relative to Consensus)
Last year, we highlighted teams we were higher than consensus on, and lower than consensus on. Cincinnati ended up missing the tournament, so that was a miss, while being higher on UCLA was a positive, and we were either closer to or in line with where the others we highlighted finished.
Here are the teams we’re most optimistic about entering this season:
- Baylor: While we are not quite as high as Pomeroy on Baylor, we are still well above the other three, and it’s one of our biggest disagreements with the polls that are largely ignoring Baylor. We have Scott Drew’s squad at No. 24 in the preseason.
- Ohio State: The Buckeyes just missed the NCAA Tournament a year ago in Jake Diebler’s first year as coach, but we see them contending this year, at No. 20 in our rankings.
- Kansas: By their lofty standards, Kansas has had a relatively down couple of years, but we have them at No. 13, higher than anyone else. The Jayhawks check in at No. 19 in both polls after being the preseason No. 1 in the polls the last two years. Kansas has not been ranked outside the Top 10 in the preseason AP poll since 2011. That year, they started at No. 13 and ended up losing to Kentucky in the national title game.
Teams We Rate Lower (Relative to Consensus)
- BYU: We have BYU at No. 17, a team that is generating a lot of buzz and ranked No. 8 in both polls. Adding to that buzz is the fact that freshman sensation A.J. Dybantsa has joined the team.
- Louisville: We have Louisville at No. 16 coming off their return-to-prominence season a year ago with Pat Kelsey as head coach. The optimism is higher elsewhere, as they rank as high as No. 10 in the Coaches Poll.
- Wisconsin: We have the Badgers at No. 30, while they are ranked No. 24 in both polls.
- USC: The Trojans have underperformed and posted consecutive losing seasons against decent expectations recently, but have added nine transfers, including Chad Baker-Mazara from Auburn and Rodney Rice from Maryland. Both of the other rating systems have them higher, but we are starting with them at No. 34.
Full 2025-26 College Basketball Rankings, From No. 1 To No. 365
Our 2025–26 college basketball rankings cover all 365 Division I teams, paired with each program’s preseason predictive rating.
That rating is expressed in points above or below a perfectly average D-I team on a neutral court (positive = better than average, negative = worse).
The table’s last eight columns show how much specific inputs contributed to each team’s rating, plus a final “market adjustment” we apply in certain cases.
Here’s a quick explanation of those factors. For a deeper dive, see our explainer on how we build college basketball ratings.
- LAST YEAR: How good a team was last season (based on final predictive rating)
- PROGRAM: Recent historical performance, excluding last season
- RET OFF: Returning offensive production, compared to typical
- RET DEF: Returning defensive production, compared to typical
- RECRUIT: Value of incoming freshman recruiting class
- TRANSFER: Value of incoming Division I transfers (JUCO transfers ignored)
- COACH: Recent coaching changes expected to have a positive or negative impact
- MARKET: Adjustment if our ratings-based projection for a team is far off the betting market or our rankings differ greatly from the AP poll
TR Rank Team 25-26 Rating LAST YR PROGRAM RET OFF RET DEF RECRUIT TRANSFER COACH MARKET
1 Houston 23.8 11.1 5.6 2.1 0.8 4.2 0.0 0.0 0.0
2 Purdue 22.1 7.1 4.6 4.8 2.6 3.0 0.0 0.0 0.0
3 Duke 19.2 12.2 4.5 -1.1 -2.0 5.6 0.0 0.0 0.0
4 UConn 18.5 5.8 4.5 2.6 1.5 4.0 0.2 0.0 0.0
5 Florida 18.4 11.3 3.1 1.2 0.6 1.5 0.7 0.0 0.0
6 Kentucky 17.7 7.4 4.3 0.4 -0.4 3.6 2.3 0.0 0.0
7 Michigan 17.5 6.8 2.5 1.0 0.5 2.0 4.2 0.0 0.5
8 St John's 17.3 7.3 3.0 0.5 -0.9 2.5 4.9 0.0 0.0
9 UCLA 17.3 6.6 4.1 2.4 0.8 1.9 1.6 0.0 0.0
11 Tennessee 17.1 9.0 5.2 -0.6 -1.3 3.5 1.2 0.0 0.0
10 Illinois 17.1 7.4 4.2 1.3 0.6 1.8 0.7 0.0 1.0
12 Arizona 17.1 8.2 4.8 1.1 -0.4 4.3 0.0 0.0 -1.0
13 Kansas 17.0 6.6 4.5 -0.8 -1.4 4.8 2.3 0.0 1.0
14 Texas Tech 17.0 8.3 3.9 1.1 -0.5 0.0 3.2 0.0 1.0
15 Alabama 16.9 9.4 4.5 1.0 -0.6 4.1 0.0 0.0 -1.5
16 Louisville 16.8 5.9 -0.1 0.1 -0.9 3.4 6.5 0.0 2.0
17 BYU 16.8 6.3 3.7 1.5 0.9 3.4 1.1 0.0 0.0
18 Iowa St 16.7 8.2 4.1 1.9 1.5 2.4 0.1 0.0 -1.5
19 Gonzaga 16.6 8.6 4.7 1.4 -0.6 1.9 0.7 0.0 0.0
20 Ohio St 16.3 5.7 3.3 3.3 0.6 2.9 1.4 0.0 -1.0
21 Michigan St 16.2 8.1 3.7 1.3 0.6 3.3 0.3 0.0 -1.0
22 Auburn 15.8 11.3 4.5 -0.6 -1.7 3.0 0.8 -1.5 0.0
23 Arkansas 15.2 5.0 3.1 1.0 0.2 4.3 1.6 0.0 0.0
24 Baylor 14.9 6.0 4.5 -1.8 -2.4 4.4 4.2 0.0 0.0
25 Creighton 14.4 5.0 4.1 0.0 -0.6 2.2 3.7 0.0 0.0
26 Mississippi St 14.4 5.5 3.0 1.0 -1.1 1.3 4.7 0.0 0.0
27 North Carolina 14.4 5.3 4.2 -0.7 -1.6 4.5 2.6 0.0 0.0
28 Missouri 14.2 6.4 1.2 1.7 0.7 3.2 0.9 0.0 0.0
29 Texas 14.0 4.4 4.4 0.4 -0.8 2.5 2.6 0.5 0.0
30 Wisconsin 14.0 7.2 3.3 1.0 0.2 0.7 1.7 0.0 0.0
31 Vanderbilt 13.9 4.1 1.5 1.2 0.6 0.0 6.5 0.0 0.0
32 Iowa 13.9 3.0 3.8 -1.4 -2.0 0.9 6.5 2.0 1.0
33 Oregon 13.6 5.9 2.8 2.0 0.6 1.0 1.2 0.0 0.0
34 USC 13.6 3.2 2.8 -1.3 -2.0 3.9 7.0 0.0 0.0
35 Georgia 13.4 4.9 0.5 0.0 -0.3 3.3 5.0 0.0 0.0
36 Maryland 13.3 8.5 2.8 -1.7 -2.3 3.1 3.4 -0.5 0.0
37 Mississippi 13.2 6.1 1.5 -0.4 -1.3 2.7 4.5 0.0 0.0
38 Indiana 13.0 3.7 2.6 -1.6 -2.1 2.9 6.0 1.5 0.0
39 Marquette 12.9 5.9 3.9 1.1 1.1 1.9 0.0 0.0 -1.0
40 Villanova 12.9 3.4 3.7 -1.0 -1.5 2.3 5.0 1.0 0.0
41 Cincinnati 12.6 4.0 2.8 -0.7 -1.5 3.1 5.0 0.0 0.0
42 Clemson 12.6 5.7 3.0 -1.1 -1.7 1.8 5.0 0.0 0.0
43 SMU 12.4 3.7 1.7 1.2 0.6 1.3 3.9 0.0 0.0
44 NC State 12.2 -0.7 2.3 -1.1 -1.5 2.2 7.5 2.5 1.0
45 Texas A&M 12.0 6.1 3.0 -1.5 -2.1 0.0 6.0 0.5 0.0
46 Providence 12.0 0.2 3.2 0.8 0.9 1.9 5.0 0.0 0.0
47 San Diego St 11.8 2.9 3.6 2.6 1.9 0.0 0.7 0.0 0.0
48 Oklahoma 11.7 4.0 3.2 -0.8 -1.6 2.0 5.0 0.0 0.0
49 Washington 11.7 -0.3 1.7 -0.2 -1.0 2.6 8.5 0.0 0.5
50 VCU 11.4 4.2 2.4 -0.7 -1.2 1.2 5.0 0.5 0.0
51 Utah St 11.3 3.4 3.1 1.7 1.5 0.0 1.6 0.0 0.0
52 Virginia 11.3 -0.7 3.1 -1.5 -1.7 2.5 7.0 0.5 2.0
53 Boise St 11.1 3.7 3.2 1.4 0.8 0.0 2.0 0.0 0.0
54 TCU 10.8 1.8 3.6 0.2 -0.4 1.7 3.8 0.0 0.0
55 Saint Mary's 10.7 5.4 4.1 1.1 -0.2 0.0 0.3 0.0 0.0
56 Nebraska 10.6 3.8 1.8 0.2 0.0 0.0 4.7 0.0 0.0
57 Northwestern 9.8 3.8 2.9 1.6 0.3 0.0 1.3 0.0 0.0
58 Kansas St 9.4 2.1 3.0 -0.9 -1.3 1.4 5.0 0.0 0.0
59 Xavier 9.3 4.3 3.3 -1.5 -2.1 0.8 5.0 -0.5 0.0
60 Pittsburgh 9.1 3.3 2.0 0.2 -1.1 0.8 4.0 0.0 0.0
61 Notre Dame 9.1 0.1 1.4 1.9 0.8 3.0 2.0 0.0 0.0
62 LSU 9.1 1.6 2.2 -0.6 -1.4 2.4 5.0 0.0 0.0
63 Wake Forest 8.2 1.5 2.9 0.2 -0.4 0.6 3.5 0.0 0.0
64 Memphis 8.2 2.7 2.6 -1.8 -2.4 0.8 6.2 0.0 0.0
65 Oklahoma St 8.2 0.1 2.5 -1.0 -1.4 2.0 6.0 0.0 0.0
66 West Virginia 8.0 4.1 2.3 -1.7 -2.2 0.0 5.5 0.0 0.0
67 Dayton 7.9 0.9 2.8 0.3 0.0 0.0 4.0 0.0 0.0
68 Miami 7.8 -3.1 3.1 -1.3 -0.7 2.9 6.5 0.5 0.0
69 San Francisco 7.8 1.7 2.5 0.9 0.5 0.0 2.2 0.0 0.0
70 Syracuse 7.6 -1.0 1.8 0.1 -0.6 2.8 4.4 0.0 0.0
71 Butler 7.2 1.6 1.7 -0.5 -1.7 1.2 5.0 0.0 0.0
72 UCF 7.2 2.1 2.3 -1.6 -2.1 0.0 6.5 0.0 0.0
73 Utah 7.0 2.3 2.4 -0.6 -1.5 0.0 5.0 -0.5 0.0
74 Minnesota 6.9 0.8 1.1 -1.0 -1.4 0.0 5.0 2.5 0.0
75 South Carolina 6.9 1.6 1.2 -1.4 -1.8 2.4 5.0 0.0 0.0
76 Colorado 6.9 1.3 2.9 0.7 0.0 1.8 1.1 0.0 -1.0
77 Virginia Tech 6.7 -2.3 2.9 1.3 1.1 0.6 2.5 0.0 0.5
78 Arizona St 6.6 1.9 1.8 -1.4 -2.1 1.3 5.0 0.0 0.0
79 New Mexico 6.5 4.4 2.2 -1.5 -2.1 0.0 4.0 -0.5 0.0
80 Yale 6.4 1.1 1.5 2.3 1.5 0.0 0.0 0.0 0.0
81 Saint Louis 6.2 -1.4 1.1 1.3 1.3 0.0 3.9 0.0 0.0
82 DePaul 6.0 -0.6 0.1 1.1 0.5 0.0 5.0 0.0 0.0
83 Rutgers 5.8 1.9 2.5 -1.2 -1.5 3.7 1.3 0.0 -1.0
84 G Washington 5.7 -2.0 -0.7 2.4 1.0 0.0 5.0 0.0 0.0
85 Georgia Tech 5.5 -0.3 0.5 0.3 0.0 2.4 1.7 0.0 1.0
86 Georgetown 5.5 0.8 -0.2 -0.4 -0.9 0.7 4.6 0.0 1.0
87 Colorado St 5.5 3.7 2.6 -0.7 -1.5 0.0 3.4 -2.0 0.0
88 Penn St 5.4 3.7 2.5 -1.0 -1.7 1.7 0.8 0.0 -0.5
89 Liberty 5.1 0.8 1.0 2.0 0.9 0.0 0.4 0.0 0.0
90 N Texas 5.1 0.7 2.5 -1.5 -2.0 0.0 5.5 0.0 0.0
91 Santa Clara 5.0 3.2 1.8 0.3 -0.4 0.0 0.1 0.0 0.0
92 Oregon St 4.9 1.1 -0.2 -0.3 -0.7 0.0 5.0 0.0 0.0
93 Grand Canyon 4.9 -0.6 2.0 -0.6 -0.9 0.0 5.0 0.0 0.0
94 Bradley 4.8 0.3 2.0 0.4 0.0 0.0 2.2 0.0 0.0
95 Stanford 4.8 0.9 1.7 0.5 0.8 0.9 0.1 0.0 0.0
96 George Mason 4.7 0.6 1.0 -0.6 -1.2 0.0 5.0 0.0 0.0
97 California 4.6 -0.7 0.1 -0.1 0.3 0.0 5.0 0.0 0.0
98 UNLV 4.6 -0.2 2.0 -1.2 -1.4 0.0 6.0 -0.5 0.0
99 Nevada 4.4 1.3 2.3 -1.0 -1.3 0.0 3.1 0.0 0.0
100 Akron 4.4 -0.6 1.0 2.0 0.7 0.0 1.4 0.0 0.0
101 N Iowa 4.2 -0.2 0.7 2.0 1.6 0.0 0.1 0.0 0.0
102 Florida St 4.1 0.8 1.1 -1.3 -1.6 0.7 5.0 -0.5 0.0
103 Duquesne 4.0 -2.5 0.3 0.9 0.7 0.0 4.6 0.0 0.0
104 UC Irvine 3.4 1.6 1.4 0.2 -0.1 0.0 0.4 0.0 0.0
105 NC Wilmington 3.1 -1.0 0.4 0.0 -0.3 0.0 4.0 0.0 0.0
106 UAB 2.7 -0.6 2.3 -1.6 -1.7 0.0 4.2 0.0 0.0
107 Tulane 2.7 -2.3 1.2 2.1 0.9 0.0 0.7 0.0 0.0
108 Chattanooga 2.5 -1.0 0.7 -0.2 -0.3 0.0 3.3 0.0 0.0
109 Illinois St 2.4 -1.8 -0.8 2.9 1.2 0.0 1.0 0.0 0.0
111 High Point 2.3 0.3 -1.0 -0.7 -0.8 0.0 5.5 -1.0 0.0
110 Seton Hall 2.3 -3.8 2.7 -1.4 -1.1 0.0 6.0 0.0 0.0
112 Belmont 2.1 -1.8 1.3 1.2 0.6 0.0 0.9 0.0 0.0
113 Saint Joseph's 2.1 0.4 0.5 0.4 0.6 0.0 0.1 0.0 0.0
114 Furman 1.8 -1.9 1.3 1.2 1.1 0.0 0.0 0.0 0.0
115 Boston College 1.7 -3.8 1.0 1.1 0.6 0.0 2.7 0.0 0.0
116 Loyola Chi 1.7 -1.2 1.2 0.1 -0.1 0.0 1.7 0.0 0.0
117 St Bonaventure 1.6 -1.4 1.1 -1.0 -1.1 0.0 4.0 0.0 0.0
118 Towson 1.6 -3.1 0.9 1.5 0.0 0.0 2.2 0.0 0.0
119 McNeese 1.6 2.0 -1.2 0.8 -0.4 0.0 1.4 -1.5 0.5
120 Ohio 1.5 -3.7 0.6 0.7 0.4 0.0 3.4 0.0 0.0
121 S Florida 1.5 -4.1 0.3 -0.5 -0.2 0.0 5.5 0.5 0.0
122 Murray St 1.4 -2.1 0.8 -1.5 -1.3 0.0 4.6 1.0 0.0
123 Wichita St 1.4 -2.0 1.2 -1.5 -1.2 0.0 5.0 0.0 0.0
124 Seattle 1.3 -2.6 0.8 1.0 0.7 0.0 1.5 0.0 0.0
126 Kent St 1.3 -1.5 0.9 0.5 0.4 0.0 1.1 0.0 0.0
125 Hawai'i 1.3 -4.9 0.2 0.8 0.3 0.0 5.0 0.0 0.0
127 Drake 1.3 2.0 2.4 -1.5 -2.1 0.0 3.0 -2.5 0.0
128 Washington St 1.3 -0.9 3.0 -0.6 -0.8 0.0 1.6 0.0 -1.0
129 UCSD 1.3 4.2 -1.0 -0.9 -1.7 0.0 1.6 -1.0 0.0
130 Charleston 1.2 -2.6 1.3 -1.4 -1.0 0.0 5.0 0.0 0.0
131 Loyola Mymt 1.2 -2.7 0.2 0.3 0.4 0.0 3.0 0.0 0.0
132 Temple 1.2 -3.2 0.5 -0.7 -0.4 0.0 5.0 0.0 0.0
133 J Madison 1.1 -3.7 1.2 -1.0 -0.3 0.0 5.0 0.0 0.0
134 Troy 1.1 -0.8 0.3 1.0 0.6 0.0 0.0 0.0 0.0
135 Utah Valley 0.8 -1.1 1.1 0.2 0.0 0.0 0.7 0.0 0.0
136 S Dakota St 0.7 -1.2 0.8 1.5 0.6 0.0 0.0 0.0 -1.0
137 Miami OH 0.7 -2.6 -1.6 2.8 1.6 0.0 0.5 0.0 0.0
138 E Tennessee St 0.6 -2.8 -0.7 -0.7 -0.2 0.0 5.0 0.0 0.0
139 W Kentucky 0.6 -3.2 0.5 -1.1 -0.5 0.0 4.9 0.0 0.0
140 New Mexico St 0.6 -2.1 -0.1 -1.3 -0.9 0.0 5.0 0.0 0.0
141 Kennesaw St 0.5 -2.6 -0.6 1.8 0.8 0.0 1.1 0.0 0.0
142 Middle Tenn 0.3 -1.7 0.1 -0.2 -0.1 0.0 2.2 0.0 0.0
143 Davidson 0.3 -2.7 1.3 -0.9 -0.1 0.0 2.7 0.0 0.0
144 Florida Atlantic 0.1 -1.1 2.6 -0.9 -0.9 0.0 0.4 0.0 0.0
145 Louisiana Tech 0.1 -2.0 1.0 -0.4 0.2 0.0 1.3 0.0 0.0
146 Jacksonville St 0.1 -1.6 -0.6 -1.0 -1.0 0.0 4.2 0.0 0.0
147 UTEP 0.0 -3.1 -0.2 -1.1 -0.6 0.0 5.0 0.0 0.0
148 Tulsa -0.1 -6.0 -0.9 -1.1 0.0 0.0 8.0 0.0 0.0
149 St Thomas -0.1 -1.4 -0.8 1.1 1.0 0.0 0.1 0.0 0.0
150 Richmond -0.2 -5.9 1.3 0.6 0.9 0.0 2.9 0.0 0.0
151 Cornell -0.2 -1.4 0.5 1.3 0.3 0.0 0.6 0.0 -1.5
152 Winthrop -0.2 -2.9 -0.5 -1.0 -0.2 0.0 4.5 0.0 0.0
153 UCSB -0.2 -2.5 0.2 0.0 0.1 0.0 2.0 0.0 0.0
154 Arkansas St -0.3 0.4 -0.7 -1.5 -1.9 0.0 5.0 -1.5 0.0
155 S Illinois -0.3 -4.0 0.8 -0.1 0.4 0.0 1.9 0.0 0.5
156 San Jose St -0.4 -3.4 -0.5 -0.9 -0.6 0.0 5.0 0.0 0.0
157 Wyoming -0.4 -3.6 1.0 -1.0 -0.4 0.0 3.6 0.0 0.0
158 Rice -0.4 -4.3 -0.7 0.5 0.3 0.0 3.7 0.0 0.0
159 NC Asheville -0.4 -4.4 -0.2 0.8 0.4 0.0 3.0 0.0 0.0
160 Toledo -0.4 -4.9 1.5 -0.2 0.7 0.0 2.5 0.0 0.0
161 Illinois Chicago -0.5 -2.9 -1.5 -0.5 -0.6 0.0 5.0 0.0 0.0
162 Rhode Island -0.5 -2.8 -0.4 -1.4 -0.9 0.0 5.0 0.0 0.0
163 E Carolina -0.7 -3.7 -0.3 0.3 0.9 0.0 2.0 0.0 0.0
164 Radford -0.8 -3.4 -1.0 -1.1 -0.8 0.0 5.0 0.5 0.0
165 S Alabama -0.8 -1.7 0.1 0.0 0.3 0.0 0.4 0.0 0.0
166 Cal Baptist -0.9 -3.3 -0.4 1.1 -0.1 0.0 1.8 0.0 0.0
167 Wright St -1.1 -4.7 -0.2 0.1 0.0 0.0 3.7 0.0 0.0
168 Harvard -1.1 -6.0 -0.6 3.0 1.4 1.2 0.0 0.0 0.0
169 E Kentucky -1.2 -4.2 -0.7 0.4 0.4 0.0 2.8 0.0 0.0
170 Princeton -1.3 -3.8 1.5 0.5 0.5 0.0 0.0 0.0 0.0
171 Indiana St -1.3 -4.1 1.3 0.1 0.1 0.0 1.4 0.0 0.0
172 N Colorado -1.3 -1.0 -1.0 0.4 -0.1 0.0 1.3 0.0 -1.0
173 Missouri St -1.4 -4.8 1.0 0.3 0.3 0.0 1.8 0.0 0.0
174 Youngstown St -1.5 -3.9 -0.1 -0.4 -0.1 0.0 3.0 0.0 0.0
175 Iona -1.5 -6.4 1.0 -1.2 -0.1 0.0 4.6 0.5 0.0
176 Hofstra -1.5 -4.6 1.1 0.9 0.4 0.0 0.6 0.0 0.0
177 Samford -1.7 -1.3 0.6 -1.5 -1.4 0.0 3.3 -1.5 0.0
178 Fordham -1.8 -5.3 0.0 -1.5 -0.4 0.0 5.0 0.5 0.0
179 Charlotte -1.8 -5.8 0.6 -0.9 -0.2 0.0 4.5 0.0 0.0
180 Purdue FW -1.8 -2.6 -0.7 -0.3 -0.4 0.0 2.2 0.0 0.0
181 Texas St -1.8 -4.3 -0.1 -0.6 -0.3 0.0 3.4 0.0 0.0
182 Southern -1.9 -4.8 -1.3 2.1 1.0 0.0 1.2 0.0 0.0
183 CS Northridge -1.9 -1.2 -2.4 -0.1 -0.2 0.0 2.0 0.0 0.0
184 Brown -2.0 -4.9 -0.4 1.3 1.1 0.0 0.0 0.0 1.0
185 Sam Houston -2.0 -3.8 0.9 -1.4 -0.6 0.0 2.9 0.0 0.0
186 Oakland -2.0 -4.1 -0.4 0.1 -0.2 0.0 2.5 0.0 0.0
187 UTSA -2.0 -4.0 -1.9 -1.3 -0.6 0.0 4.8 0.0 1.0
188 Incarnate Word -2.0 -5.2 -3.7 1.3 0.8 0.0 4.8 0.0 0.0
189 Lipscomb -2.0 -0.2 -0.7 -0.5 -0.2 0.0 0.0 -0.5 0.0
190 App State -2.1 -3.9 0.6 -0.7 -0.1 0.0 2.0 0.0 0.0
191 UMass -2.2 -4.7 0.4 -0.5 0.1 0.0 2.6 0.0 0.0
192 San Diego -2.2 -7.5 -1.0 -0.9 0.2 0.0 6.0 0.0 1.0
193 N Alabama -2.3 -1.7 -1.8 0.6 0.6 0.0 0.0 0.0 0.0
194 SF Austin -2.3 -6.2 0.5 -0.4 0.3 0.0 2.5 1.0 0.0
195 N Dakota St -2.4 -1.5 -0.8 -0.6 0.2 0.0 0.8 0.0 -0.5
196 Old Dominion -2.4 -7.7 -0.6 0.6 0.4 0.0 3.9 0.0 1.0
197 Campbell -2.5 -4.4 -1.5 -1.1 -0.5 0.0 5.0 0.0 0.0
198 Abl Christian -2.5 -5.2 -0.2 0.7 0.5 0.0 1.2 0.0 0.5
199 Vermont -2.5 -5.9 1.4 0.7 0.1 0.0 1.2 0.0 0.0
200 Marshall -2.5 -3.7 -0.1 -0.3 -0.2 0.0 1.8 0.0 0.0
201 La Salle -2.5 -4.8 -0.7 -1.4 -0.6 0.0 5.0 0.0 0.0
202 Montana -2.5 -3.0 -0.4 0.2 0.2 0.0 0.5 0.0 0.0
203 Omaha -2.6 -2.9 -2.7 1.4 1.2 0.0 0.5 0.0 0.0
204 FGCU -2.7 -3.9 -0.7 0.2 0.7 0.0 0.5 0.0 0.5
205 Longwood -2.8 -4.2 0.0 0.7 0.3 0.0 1.3 -1.0 0.0
207 Colgate -2.9 -6.0 0.7 1.3 1.0 0.0 0.2 0.0 0.0
206 CS Bakersfield -2.9 -4.8 -1.6 -0.1 0.3 0.0 3.8 -0.5 0.0
208 UT Arlington -2.9 -5.0 -0.4 -0.7 0.0 0.0 3.1 0.0 0.0
209 Wofford -3.0 -2.0 -0.2 -0.9 -0.7 0.0 1.3 -0.5 0.0
210 Navy -3.1 -6.9 -1.1 3.4 1.5 0.0 0.0 0.0 0.0
211 Little Rock -3.1 -5.5 -2.0 1.2 0.5 0.0 1.7 0.0 1.0
212 Portland St -3.1 -4.1 -1.4 1.3 0.8 0.0 0.2 0.0 0.0
213 Quinnipiac -3.2 -4.9 -0.6 0.8 0.3 0.0 1.2 0.0 0.0
214 NC Greensboro -3.2 -2.6 0.3 -1.5 -1.1 0.0 1.6 0.0 0.0
215 Fresno St -3.3 -6.1 0.6 -0.2 0.1 0.0 2.2 0.0 0.0
216 Montana St -3.4 -3.4 0.0 -0.1 -0.1 0.0 0.2 0.0 0.0
217 Norfolk St -3.5 -3.7 -0.6 -1.3 -0.6 0.0 2.8 0.0 0.0
218 Idaho -3.5 -6.0 -2.8 2.3 1.2 0.0 1.7 0.0 0.0
219 Robert Morris -3.5 -2.3 -2.1 -0.9 -1.0 0.0 2.8 0.0 0.0
220 Pacific -3.5 -6.7 -2.3 0.0 0.5 0.0 5.0 0.0 0.0
221 Texas A&M-CC -3.5 -2.8 -0.8 -0.7 -0.4 0.0 1.2 0.0 0.0
222 Nicholls -3.6 -3.2 -1.2 -0.4 0.2 0.0 1.0 0.0 0.0
223 Monmouth -3.6 -6.0 -1.3 0.8 1.2 0.0 1.7 0.0 0.0
224 Florida Intl -3.7 -6.2 -1.4 -1.1 0.0 0.0 5.0 0.0 0.0
225 William & Mary -3.7 -5.2 -2.7 0.2 0.3 0.0 3.7 0.0 0.0
226 Dartmouth -3.7 -4.6 -1.8 1.9 0.8 0.0 0.0 0.0 0.0
227 Milwaukee -3.8 -2.0 -1.8 -0.5 -0.4 0.0 0.8 0.0 0.0
228 Drexel -3.8 -3.8 0.2 -0.2 0.4 0.0 0.2 0.0 -0.5
229 E Washington -3.8 -6.7 0.0 1.4 0.2 0.0 1.2 0.0 0.0
230 Marist -4.0 -6.5 -1.2 1.5 1.2 0.0 1.0 0.0 0.0
231 Pepperdine -4.0 -4.3 -1.0 -1.2 -0.5 0.6 2.5 0.0 0.0
232 Elon -4.0 -4.3 -2.4 -1.3 -0.4 0.0 4.4 0.0 0.0
233 SE Missouri St -4.1 -4.2 -2.4 1.6 1.0 0.0 0.0 0.0 0.0
234 Siena -4.2 -5.8 -2.2 2.7 0.8 0.0 0.3 0.0 0.0
235 Bethune -4.2 -7.1 -3.5 0.5 0.4 0.0 5.5 0.0 0.0
236 SE Louisiana -4.2 -4.0 -2.0 -0.4 0.2 0.0 2.0 0.0 0.0
237 Louisiana -4.4 -8.4 0.5 -0.5 0.4 1.2 2.4 0.0 0.0
238 Lamar -4.4 -3.5 -3.0 0.4 0.7 0.0 0.0 0.0 1.0
239 Northeastern -4.4 -4.5 -1.7 0.6 0.3 0.0 0.8 0.0 0.0
240 Sacramento St -4.5 -8.8 -2.1 -1.4 0.4 0.0 6.9 0.5 0.0
241 Tennessee St -4.5 -5.6 -2.0 0.9 0.7 0.0 0.5 1.0 0.0
242 Bowling Green -4.5 -7.1 -1.7 -0.1 0.4 0.0 2.9 0.0 1.0
243 Jackson St -4.5 -6.3 -2.3 1.7 0.7 0.0 1.6 0.0 0.0
244 Merrimack -4.6 -4.3 -1.9 -1.2 -0.4 0.0 3.2 0.0 0.0
245 Hampton -4.6 -4.6 -3.5 0.0 0.3 0.0 3.1 0.0 0.0
246 SIU Edward -4.6 -4.8 -1.8 0.7 0.6 0.0 0.7 0.0 0.0
247 UC Davis -4.7 -5.5 -0.4 0.6 0.4 0.0 0.7 0.0 -0.5
248 Ball St -4.7 -6.2 -1.0 -1.4 0.0 0.0 3.9 0.0 0.0
249 Cleveland St -4.8 -2.8 -0.5 -1.5 -1.1 0.0 0.6 0.5 0.0
250 NW State -4.9 -5.3 -2.6 0.8 0.4 0.0 1.8 0.0 0.0
251 UT Rio Grande -4.9 -5.5 -2.3 -0.7 0.2 0.0 3.5 0.0 0.0
252 Portland -5.0 -6.6 -0.8 -1.0 0.6 0.0 2.7 0.0 0.0
253 Columbia -5.1 -7.1 -3.0 2.1 0.8 0.0 0.5 1.0 0.5
254 S Utah -5.2 -7.8 0.1 -1.4 0.3 0.0 3.7 0.0 0.0
255 Georgia So -5.2 -6.3 -1.3 -0.7 0.0 0.0 3.2 0.0 0.0
256 Mercer -5.2 -5.8 -0.7 -1.1 0.0 0.0 2.3 0.0 0.0
257 Stony Brook -5.2 -9.2 -1.6 -0.8 0.5 0.0 5.9 0.0 0.0
258 Delaware -5.3 -5.3 -0.3 -0.5 0.1 0.0 0.6 0.0 0.0
259 Queens -5.4 -4.9 -1.9 0.7 0.1 0.0 0.7 0.0 0.0
260 Sacred Heart -5.4 -6.3 -2.6 1.2 0.5 0.0 1.8 0.0 0.0
261 Valparaiso -5.4 -4.1 -1.5 -1.3 -0.5 0.0 2.1 0.0 0.0
262 S Indiana -5.4 -8.8 -2.8 -1.4 0.2 0.0 7.4 0.0 0.0
263 Cal Poly -5.4 -3.5 -2.6 0.5 0.1 0.0 0.0 0.0 0.0
264 UC Riverside -5.5 -3.3 -0.2 -1.4 -0.7 0.0 1.6 -1.5 0.0
265 Long Beach St -5.5 -7.8 -0.1 -1.3 0.5 0.0 3.2 0.0 0.0
266 Bryant -5.6 -2.5 -0.5 -1.0 -0.8 0.0 0.2 -1.0 0.0
267 Evansville -5.6 -5.6 -2.5 -0.2 0.4 0.0 1.8 0.0 0.5
268 N Kentucky -5.6 -4.8 -0.5 -0.6 -0.1 0.0 0.8 0.0 -0.5
269 Mt St Mary's -5.7 -5.8 -1.5 -0.6 0.3 0.0 1.9 0.0 0.0
270 Boston U -5.7 -7.6 -1.5 2.4 1.0 0.0 0.0 0.0 0.0
271 Texas So -5.7 -6.7 -1.4 1.9 0.6 0.0 0.0 0.0 0.0
272 Weber St -5.8 -6.2 -0.1 0.1 0.1 0.0 0.7 0.0 -0.5
273 Idaho St -5.8 -3.8 -2.1 -0.1 0.3 0.0 0.5 0.0 -0.5
274 Manhattan -5.8 -5.8 -2.5 1.7 0.7 0.0 0.1 0.0 0.0
275 Utah Tech -5.9 -7.9 -1.1 -0.5 0.5 0.0 2.1 0.0 1.0
276 Jacksonville -5.9 -4.7 -1.2 -0.9 0.0 0.0 1.0 0.0 0.0
277 Presbyterian -5.9 -5.4 -2.3 0.3 0.7 0.0 0.8 0.0 0.0
278 UMass Lowell -6.0 -5.5 -0.1 -1.5 -0.4 0.0 1.6 0.0 0.0
279 Tarleton St -6.1 -7.6 0.1 -0.3 0.4 0.0 1.3 0.0 0.0
280 Penn -6.1 -7.7 -0.3 0.9 0.5 0.0 0.0 0.5 0.0
281 Coastal Car -6.1 -8.6 -1.4 -0.4 0.4 0.0 2.9 0.0 1.0
282 N Arizona -6.1 -5.2 -2.3 -0.5 0.0 0.0 1.9 0.0 0.0
283 New Orleans -6.2 -10.0 -3.0 -0.5 1.7 0.0 5.7 0.0 0.0
284 Bucknell -6.2 -4.9 -2.4 0.3 0.5 0.0 0.3 0.0 0.0
285 Grambling -6.3 -7.7 -1.7 -1.4 0.2 0.0 4.9 -0.5 0.0
286 E Michigan -6.3 -6.8 -2.8 -1.4 0.0 0.0 4.7 0.0 0.0
287 South Dakota -6.3 -5.0 -1.9 0.4 -0.6 0.0 0.8 0.0 0.0
288 Hou Christian -6.4 -6.7 -4.3 0.5 0.5 0.0 3.6 0.0 0.0
289 Austin Peay -6.5 -6.8 -2.0 0.3 0.6 0.0 1.4 0.0 0.0
290 Morehead St -6.5 -8.7 0.0 -0.7 0.4 0.0 2.4 0.0 0.0
291 Saint Peter's -6.6 -7.1 -0.6 0.4 0.3 0.0 0.4 0.0 0.0
292 Georgia St -6.6 -6.5 -0.8 -0.1 0.7 0.0 0.0 0.0 0.0
293 C Michigan -6.7 -4.5 -2.6 -1.5 -0.7 0.0 2.1 0.5 0.0
294 Maine -6.7 -4.8 -2.5 -0.7 -0.1 0.0 1.4 0.0 0.0
295 Alabama St -6.8 -6.5 -3.1 -0.4 0.2 0.0 3.0 0.0 0.0
296 Oral Roberts -6.8 -8.1 0.4 -1.4 0.7 0.0 1.7 0.0 0.0
297 VMI -6.9 -7.5 -3.1 2.5 1.3 0.0 0.0 0.0 0.0
298 UMBC -7.0 -7.4 -1.4 0.2 0.4 0.0 1.2 0.0 0.0
299 LIU -7.0 -7.4 -3.8 2.0 0.5 0.0 0.6 0.0 1.0
300 W Carolina -7.1 -9.9 -0.8 1.6 0.3 0.0 1.2 0.0 0.5
301 W Michigan -7.1 -7.1 -2.6 -0.9 0.2 0.0 2.8 0.0 0.5
302 Kansas City -7.1 -5.0 -1.4 -0.5 -0.1 0.0 0.8 0.0 -1.0
303 Southern Miss -7.2 -7.7 -1.2 -1.4 0.2 0.0 2.8 0.0 0.0
304 Air Force -7.3 -7.3 -0.8 0.5 0.4 0.0 0.0 0.0 0.0
305 American -7.4 -5.9 -2.3 0.4 0.5 0.0 0.0 0.0 0.0
306 S Carolina St -7.4 -3.9 -3.5 1.4 0.5 0.0 0.0 0.0 -2.0
307 C Connecticut -7.4 -4.1 -2.9 -0.8 -0.3 0.0 0.6 0.0 0.0
308 Lafayette -7.5 -7.0 -2.4 1.1 0.7 0.0 0.0 0.0 0.0
309 Detroit Mercy -7.6 -8.9 -1.9 2.2 0.6 0.0 0.0 0.0 0.5
310 Gardner-Webb -7.7 -6.1 -0.5 -1.4 -0.1 0.0 0.4 0.0 0.0
311 Lehigh -7.7 -7.4 -1.9 1.0 0.6 0.0 0.0 0.0 0.0
312 W Georgia -7.7 -9.8 -3.4 1.7 0.4 0.0 3.4 0.0 0.0
313 Alabama A&M -8.0 -11.7 -2.9 -1.0 1.0 0.0 6.2 0.5 0.0
314 Fairfield -8.0 -9.3 -0.8 -0.1 0.5 0.0 1.7 0.0 0.0
315 Howard -8.0 -7.5 -1.3 -1.2 0.2 0.0 1.9 0.0 0.0
316 Delaware St -8.0 -7.2 -3.9 -0.6 0.2 0.0 3.5 0.0 0.0
317 Loyola MD -8.0 -7.8 -2.7 1.3 0.8 0.0 0.4 0.0 0.0
318 Rider -8.1 -7.9 -0.9 -0.2 0.3 0.0 0.6 0.0 0.0
319 NC Central -8.2 -7.2 -1.3 -1.1 0.3 0.0 2.1 0.0 -1.0
320 Albany -8.2 -6.7 -2.3 -0.9 0.1 0.0 1.6 0.0 0.0
321 North Dakota -8.2 -6.0 -2.3 -0.6 0.6 0.0 0.0 0.0 0.0
322 N Illinois -8.3 -10.4 -1.9 -1.5 0.8 0.0 4.7 0.0 0.0
323 Lindenwood -8.5 -8.2 -3.8 1.2 0.4 0.0 1.8 0.0 0.0
324 UT Martin -8.6 -6.6 -1.7 -0.3 0.4 0.0 0.1 0.0 -0.5
325 Binghamton -8.7 -8.3 -2.2 -1.0 0.4 0.0 2.3 0.0 0.0
326 Alcorn St -8.8 -8.7 -1.9 -0.8 0.5 0.0 2.7 -0.5 0.0
327 Florida A&M -9.0 -8.4 -3.5 -0.9 0.4 0.0 3.4 0.0 0.0
328 Denver -9.0 -7.6 -2.0 -1.2 0.3 0.0 1.4 0.0 0.0
329 Green Bay -9.1 -8.9 -3.3 0.7 0.4 0.0 2.0 0.0 0.0
330 Charleston So -9.1 -8.0 -3.0 -1.2 0.5 0.0 2.6 0.0 0.0
331 Tenn Tech -9.2 -7.4 -2.4 -0.6 0.2 0.0 1.0 0.0 0.0
332 Buffalo -9.2 -9.8 -1.2 0.3 0.5 0.0 1.0 0.0 0.0
333 E Illinois -9.3 -8.3 -3.7 0.9 0.4 0.0 1.5 0.0 0.0
334 Bellarmine -9.4 -10.2 -1.6 0.9 0.4 0.0 0.1 0.5 0.5
335 N Florida -9.4 -6.4 -1.4 -1.2 0.7 0.0 0.4 -0.5 -1.0
336 W Illinois -9.5 -9.7 -1.6 -1.5 -0.3 0.0 3.7 0.0 0.0
337 CS Fullerton -9.6 -10.9 -0.1 -1.4 0.9 0.0 1.9 0.0 0.0
338 Canisius -9.6 -11.7 -1.6 -1.6 0.6 0.0 4.6 0.0 0.0
339 Niagara -9.7 -8.2 -1.2 -1.1 0.4 0.0 0.4 0.0 0.0
340 Chicago St -9.9 -12.4 -2.6 -1.3 1.1 0.0 4.3 1.0 0.0
341 Army -9.9 -8.2 -2.4 0.2 0.4 0.0 0.0 0.0 0.0
342 E Texas A&M -10.0 -8.7 -3.0 -0.3 0.5 0.0 1.1 0.0 0.5
343 Stonehill -10.0 -8.5 -3.7 0.0 0.5 0.0 1.6 0.0 0.0
344 Morgan St -10.0 -8.6 -2.8 -1.1 0.5 0.0 2.0 0.0 0.0
345 SC Upstate -10.2 -10.2 -1.7 0.8 0.6 0.0 0.3 0.0 0.0
346 St Francis PA -10.2 -7.9 -3.5 -1.0 0.3 0.0 2.0 0.0 0.0
347 NC A&T -10.3 -8.8 -3.0 -0.4 0.4 0.0 1.5 0.0 0.0
348 UL Monroe -10.3 -10.5 -2.1 -1.2 0.9 0.0 2.1 0.5 0.0
349 Prairie View -10.4 -11.6 -2.5 -1.6 1.7 0.0 3.2 0.0 0.5
350 New Hampshire -10.5 -11.7 -1.4 -0.3 1.0 0.0 2.0 0.0 0.0
351 The Citadel -10.5 -11.8 -1.7 0.3 1.4 0.0 0.2 0.0 1.0
352 Le Moyne -10.7 -10.7 -3.0 -0.7 0.5 0.0 2.7 0.0 0.5
353 F Dickinson -10.7 -7.8 -3.1 -1.4 0.2 0.0 1.4 0.0 0.0
354 Holy Cross -10.7 -8.2 -3.7 0.8 0.4 0.0 0.0 0.0 0.0
355 Stetson -11.0 -10.7 -1.0 -0.7 0.5 0.0 0.9 0.0 0.0
356 Wagner -11.5 -9.6 -1.4 -1.1 0.6 0.0 0.0 0.0 0.0
357 NJIT -12.1 -10.9 -3.3 0.1 0.4 0.0 1.5 0.0 0.0
358 Mercyhurst -12.3 -9.5 -3.4 0.1 0.5 0.0 0.0 0.0 0.0
359 New Haven -12.4
360 IU Indy -12.7 -7.5 -4.3 -1.6 0.7 0.0 0.0 0.0 0.0
361 C Arkansas -13.5 -9.9 -3.3 -1.0 0.7 0.0 0.0 0.0 0.0
362 Maryland ES -13.7 -12.1 -2.8 0.4 0.3 0.0 0.5 0.0 0.0
363 AR-Pine Bluff -14.9 -14.2 -3.7 -1.4 0.5 0.0 3.9 0.0 0.0
364 Coppin St -15.9 -12.7 -3.7 -0.6 0.9 0.0 0.1 0.0 0.0
365 Miss Valley St -24.8 -19.6 -4.3 -0.7 -0.1 0.0 0.0 0.0 0.0
What Do We Use These Ratings For?
Our preseason ratings power all preseason projections and act as Bayesian priors for our in-season predictive ratings. In plain English: they continue to inform team strength months into the year because they’ve proved predictive, but their weight fades as new game data rolls in.
Based on these ratings, we’ve run full-season projections, including:
- NCAAB Projected Conference Standings: Expected conference and overall records, plus win odds for regular-season titles and conference tournaments.
- Bracketology Projections: Odds to make the NCAA tournament, projected seeds, and more (don’t miss the Bracketology by Conference view).
- NCAA Tournament Bracket Predictions: Round-by-round advancement odds—Sweet 16, Final Four, and title probabilities.
With the 2025–26 preseason ratings published, all of these pages are fully automated and update every morning throughout the season.
Ratings Accuracy
Several respected analysts, such as Ken Pomeroy, Dan Hanner, and Bart Torvik, have evaluated our preseason ratings and projections against other stat-based systems in prior years, and we’ve consistently performed well.
We also reference John Wobus’s multi-season comparison for a more recent look. A few notes on his tables:
-
“Week0” reflects preseason rating accuracy.
-
“Overall” blends performance across ratings released throughout the season; we ranked No. 1 in 2022–23 on this metric.
-
We exclude the “Consensus” aggregator when tallying our placement.
Wobus’s site only tracked through the 2022–23 season, and we haven’t found a comparable preseason accuracy resource for more current seasons. If you know of one, please let us know!
For the years we do have comparison data for, here is how we fared:
- 2022-23: 3rd of 22 (behind Evan Miya, Pomeroy)
- 2021-22: 3rd of 23 (behind INCC, Sagarin)
- 2020-21: 3rd of 21 (behind Lefevre, INCC)
- 2019-20: 5th of 20 (behind Lefevre, INCC, Sagarin, Pomeroy)
- 2018-19: 4th of 18 (behind Torvik, Gasaway, Pomeroy)
- 2017-18: 2nd of 7 (behind Hanner)
- 2016-17: 4th of 7 (behind Torvik, Hanner, Gasaway)
- 2015-16: 2nd of 7 (behind Hanner)
- 2014-15: 2nd of 4 (behind Hanner)
- 2013-14: 2nd of 4 (behind Hanner)
- 2012-13: 1st of 3
Based on these results, we feel confident that our system has ranked among the most accurate over the long term. While Dan Hanner’s player-based projections consistently edged us out when he was active, he stopped after the 2017-18 season. More recently, the INCC system is the only one that has regularly outperformed ours, though it doesn’t have as extensive a historical track record. Kudos as well to Evan Miya for an outstanding 2023!
We also use preseason ratings to guide our Bracketology predictions for the NCAA Tournament. Last year, before any games had started, we correctly projected 40 of the 68 teams (59%) that eventually made the 2025 NCAA Tournament. We correctly projected three of the four No. 1 seeds (and our fourth was a No. 2 seed). Twenty-six of the 28 teams on our projected top seven seed lines actually made the NCAA Tournament.
We share these results not to boast but to address the inevitable “Team X is WAY too high/low in your rankings!” comments. While our rankings are certainly not flawless, they have consistently held their own against other top-tier projection systems, and we expect them to do so again this season.
Final Advice On Interpreting College Basketball Rankings
Rankings are a starting point, not gospel. Use them to frame expectations and spot value, but keep these in mind:
- Predictive vs. results: Our ratings estimate future performance on a neutral court; they’re not a resume or power poll.
- Tiers > exact ranks: Small gaps mean teams are effectively peers—don’t overreact to being 12th vs. 15th.
- Priors fade: Preseason inputs carry weight early, then diminish as game data accumulates. Early swings aren’t always “real.”
- Context matters: Injuries, suspensions, transfers gaining eligibility, and travel spots can move the needle faster than models update.
- Strength of schedule: Records can deceive; ratings adjust for opponent quality and game location (home/away/neutral).
- Uncertainty is real: Close projections are coin flips. Treat 1–2 point edges as modest, not locks.
- Human vs. model gaps: Polls reflect perception; models reflect projected strength. Disagreements can signal opportunity or missing info.
- Look at components: If a team’s rating rides on one factor (e.g., returning minutes), it’s more fragile than a balanced profile.
- Update cadence: Pages refresh daily in-season; check back after major injuries or high-leverage games.
- Decision support: Combine ratings with matchup specifics (tempo, shot profile, foul rates) before making picks or bets.
Bottom line: think in probabilities and tiers, not absolutes. Let the numbers guide you, then layer in fresh context to make smarter calls.
Look at Ratings, Not Just Rankings
Rankings are handy, but the rating tells you more.
Example: One team may be ranked No. 25 in our preseason list, yet its rating is less than one point behind the No. 15-ranked team. This represents a large cluster of similarly rated teams through this stretch.
Takeaway: don’t fixate on the exact rank. Use the rating to identify a team’s performance tier.
Premium Sports Picks
Betting - Survivor - Pick’em