College Football Preseason Rankings 2021: Alabama Vs. Four Challengers
Alabama tops our college football rankings again in 2021, while four other leading contenders hope to break the Crimson Tide's dominance.
August 19, 2021 - by Jason Lisk
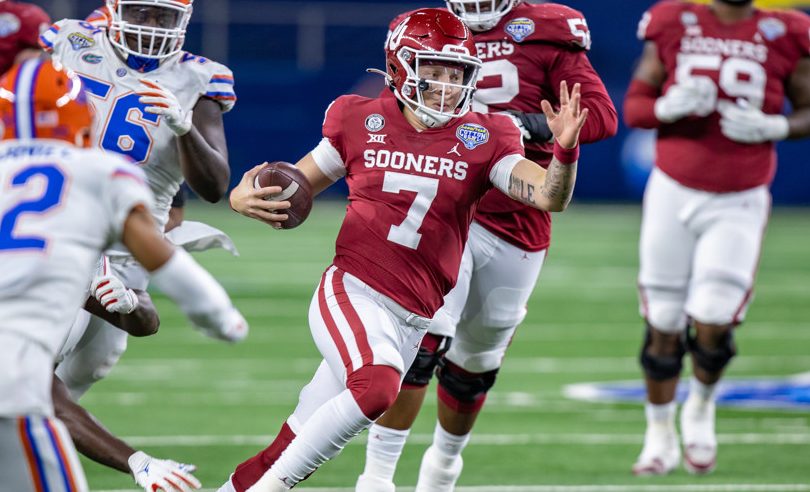
Spencer Rattler and Oklahoma will try to dethrone Alabama (Matthew Visinsky/Icon Sportswire)
We’ve released the official TeamRankings 2021 college football preseason rankings and predictive ratings.
To learn about the methodology behind our (mostly) data-driven preseason team ratings, read our post on How We Make College Football Preseason Rankings. We also have some 2021-specific adjustment notes below, coming off a truly unusual 2020 season.
Keep reading to find out how good or bad we expect all 130 FBS teams to be in 2021, starting with the TR Top 25.
Golf Pool Picks
Get an edge in your PGA Majors and One And Done pools
2021 TR College Football Preseason Top 25
Jump to rankings for all 130 FBS teams
The table below presents our 25 highest-ranked teams in the preseason (e.g. Alabama at No. 1), along with their associated preseason predictive ratings (e.g. 34.9 for Alabama).
The final five columns of the table show the relative contribution that specific predictive factors and our “market adjustment” made to our final preseason rating for each team. We’ll explain those factors more below.
| Rank | Team | Rating | LAST YEAR | PROGRAM | RETURN | LUCK | MARKET |
|---|---|---|---|---|---|---|---|
| 1 | Alabama | 34.9 | 29.0 | 6.7 | -4.1 | -2.7 | 5.9 |
| 2 | Clemson | 30.2 | 20.5 | 6.4 | -5.7 | -0.9 | 9.9 |
| 3 | Ohio State | 28.2 | 20.0 | 5.7 | -2.5 | 1.3 | 3.6 |
| 4 | Oklahoma | 27.7 | 18.6 | 4.8 | 2.0 | -0.9 | 3.2 |
| 5 | Georgia | 26.6 | 16.2 | 5.4 | -0.5 | 1.6 | 3.9 |
| 6 | Texas A&M | 19.8 | 13.9 | 2.1 | 0.1 | 0.0 | 3.6 |
| 7 | Iowa State | 18.9 | 14.2 | 2.4 | 2.1 | -1.2 | 1.5 |
| 8 | Wisconsin | 18.3 | 11.5 | 4.0 | -2.1 | -0.8 | 5.7 |
| 9 | Florida | 16.5 | 13.4 | 1.8 | -7.3 | 0.5 | 8.2 |
| 10 | Louisiana State | 16.3 | 4.7 | 3.5 | 0.3 | 1.5 | 6.2 |
| 11 | Cincinnati | 16.3 | 13.3 | -0.5 | 0.8 | -1.6 | 4.3 |
| 12 | Penn State | 16.0 | 6.2 | 5.1 | 1.4 | 0.8 | 2.5 |
| 13 | North Carolina | 15.4 | 10.1 | -0.5 | -2.1 | 0.5 | 7.4 |
| 14 | Miami | 15.3 | 9.5 | 2.2 | 4.0 | -0.7 | 0.3 |
| 15 | Oregon | 15.2 | 6.7 | 2.0 | -1.0 | -0.7 | 8.3 |
| 16 | Notre Dame | 15.2 | 14.5 | 4.2 | -4.0 | 0.0 | 0.4 |
| 17 | Iowa | 14.1 | 15.2 | 3.4 | -0.8 | -2.4 | -1.2 |
| 18 | Texas | 13.9 | 13.6 | 2.7 | -3.5 | -1.4 | 2.5 |
| 19 | Utah | 13.9 | 4.5 | 2.2 | 3.6 | 0.3 | 3.3 |
| 20 | Auburn | 13.6 | 8.4 | 4.2 | -3.1 | -0.5 | 4.5 |
| 21 | Indiana | 13.5 | 12.1 | 0.9 | 2.5 | -3.5 | 1.5 |
| 22 | Texas Christian | 13.3 | 8.5 | 2.6 | 3.5 | 0.2 | -1.5 |
| 23 | Michigan | 12.9 | 0.9 | 3.5 | -0.9 | 0.9 | 8.5 |
| 24 | Mississippi | 12.8 | 6.8 | 0.2 | 0.3 | 1.3 | 4.1 |
| 25 | Washington | 12.5 | 1.6 | 3.7 | 2.3 | -0.8 | 5.7 |
Preseason Ratings Predictive Factors
We’ve done a lot of research over the years to identify and value team-level stats that are highly correlated with success in the upcoming college football season.
We’ve also done research to identify information that seems like it should help determine a team’s future performance, but actually doesn’t hold up to rigorous historical testing.
While we encourage you to read our full preseason rankings methodology, here’s a quick explanation of the factors we currently use in our preseason ratings:
- LAST YEAR: How good a team was last year
- PROGRAM: How good a team has been in recent history (excluding last year)
- RETURN: Measure of returning player performance in several key stat areas
- LUCK: How likely a team is to improve in higher-variance metrics (e.g. turnovers)
- MARKET: Adjustment if our initial projection is far off the betting market or AP Poll
The Relative Importance Of Rankings Factors
You can see from the relative values in the table above that certain predictive factors are worth more than others. For example, how a team did last season (LAST YEAR) tends to be a very good predictor of how it will do this season.
In comparison, how a team has done over a longer period of recent history (PROGRAM) — more a measure of its success at perennially restocking talent and developing players — also has a predictive impact, but the correlation with upcoming season performance generally isn’t as strong as LAST YEAR.
MARKET, the lone subjective factor of the bunch, can vary widely from team to team. It is an adjustment we make based on team-specific factors that likely represent blind spots in our current preseason ratings algorithm.
It deserves an appropriate explanation, which you can also find in our preseason rankings explanation post.
Market Factors Are More Important In 2021
This year, the market factors are weighted more heavily than a typical year, and so you will see some bigger adjustments than past years.
The 2020 college football season was one unlike any we had seen in a century because of the COVID-19 pandemic. A handful of teams did not play. A number of players opted out of the season. Several conferences did not begin playing until November and played only conference games.
Many games were postponed or canceled because of outbreaks, and key players missed games even if their team did play. Schedules and routines were disrupted.
College football seasons have a relatively small sample size of games compared to other sports. Add in all of the change that last year brought, and it would be risky to assume that the “LAST YEAR” predictive factor would have as much meaning as it usually does.
As a result, the consensus market factors have more weight in this year’s ratings.
College Football Preseason Rankings Highlights
- Alabama plus four top contenders. Our 2021 preseason ratings have Alabama at the top (surprise!), then four teams who are very close in rating (Clemson, Ohio State, Oklahoma, and Georgia), followed by a big drop-off.
- Look at ratings, not rankings. People tend to fixate on rankings, but looking at ratings is more important. Yes, Georgia ranks No. 5, but the difference between the Bulldogs and No. 6 Texas A&M is nearly seven points, putting Georgia closer in rating to No. 2 Clemson.
- It’s a top-heavy year. The ratings are top-heavy, and No. 7 Iowa State is closer to No. 28 USC than it is to No. 5 Georgia. There’s a large upper middle class of teams in the rest of the Top 25, and not much separates those teams, but they rate well below the national title contenders.
- Less respect for non-Power Five than AP. The highest-ranked non-Power Five team is Cincinnati at No. 11. No other team outside the Power Five conferences (and Notre Dame) appears in the Top 25. That’s a big difference from the AP Poll, which includes Coastal Carolina and Louisiana. Those teams are at No. 45 and No. 33 in our rankings, respectively.
- Less respect for Pac-12 than AP. The Pac-12 has as many teams in the AP Top 25 as the SEC does (five each). But in our rankings, the SEC has seven of the Top 25, while only three Pac-12 teams appear, none of which are higher than No. 15 Oregon.
- Biggest upward market adjustments. The biggest market adjustment upward is for Clemson, which lost a lot of talent but is expected to maintain its status as a top program that reloads. Oregon and Michigan come next. Oregon played only seven games and had two fluky losses before winning the Pac-12 title; Michigan had a terrible year and played only six games.
2021 Preseason Rankings (All Teams)
| Rank | Team | Rating | LAST YEAR | PROGRAM | RETURN | LUCK | MARKET |
|---|---|---|---|---|---|---|---|
| 1 | Alabama | 34.9 | 29.0 | 6.7 | -4.1 | -2.7 | 5.9 |
| 2 | Clemson | 30.2 | 20.5 | 6.4 | -5.7 | -0.9 | 9.9 |
| 3 | Ohio State | 28.2 | 20.0 | 5.7 | -2.5 | 1.3 | 3.6 |
| 4 | Oklahoma | 27.7 | 18.6 | 4.8 | 2.0 | -0.9 | 3.2 |
| 5 | Georgia | 26.6 | 16.2 | 5.4 | -0.5 | 1.6 | 3.9 |
| 6 | Texas A&M | 19.8 | 13.9 | 2.1 | 0.1 | 0.0 | 3.6 |
| 7 | Iowa State | 18.9 | 14.2 | 2.4 | 2.1 | -1.2 | 1.5 |
| 8 | Wisconsin | 18.3 | 11.5 | 4.0 | -2.1 | -0.8 | 5.7 |
| 9 | Florida | 16.5 | 13.4 | 1.8 | -7.3 | 0.5 | 8.2 |
| 10 | Louisiana State | 16.3 | 4.7 | 3.5 | 0.3 | 1.5 | 6.2 |
| 11 | Cincinnati | 16.3 | 13.3 | -0.5 | 0.8 | -1.6 | 4.3 |
| 12 | Penn State | 16.0 | 6.2 | 5.1 | 1.4 | 0.8 | 2.5 |
| 13 | North Carolina | 15.4 | 10.1 | -0.5 | -2.1 | 0.5 | 7.4 |
| 14 | Miami | 15.3 | 9.5 | 2.2 | 4.0 | -0.7 | 0.3 |
| 15 | Oregon | 15.2 | 6.7 | 2.0 | -1.0 | -0.7 | 8.3 |
| 16 | Notre Dame | 15.2 | 14.5 | 4.2 | -4.0 | 0.0 | 0.4 |
| 17 | Iowa | 14.1 | 15.2 | 3.4 | -0.8 | -2.4 | -1.2 |
| 18 | Texas | 13.9 | 13.6 | 2.7 | -3.5 | -1.4 | 2.5 |
| 19 | Utah | 13.9 | 4.5 | 2.2 | 3.6 | 0.3 | 3.3 |
| 20 | Auburn | 13.6 | 8.4 | 4.2 | -3.1 | -0.5 | 4.5 |
| 21 | Indiana | 13.5 | 12.1 | 0.9 | 2.5 | -3.5 | 1.5 |
| 22 | Texas Christian | 13.3 | 8.5 | 2.6 | 3.5 | 0.2 | -1.5 |
| 23 | Michigan | 12.9 | 0.9 | 3.5 | -0.9 | 0.9 | 8.5 |
| 24 | Mississippi | 12.8 | 6.8 | 0.2 | 0.3 | 1.3 | 4.1 |
| 25 | Washington | 12.5 | 1.6 | 3.7 | 2.3 | -0.8 | 5.7 |
| 26 | Oklahoma State | 12.3 | 10.4 | 3.1 | -2.3 | 0.5 | 0.7 |
| 27 | Arizona State | 12.0 | 14.0 | 1.0 | 4.4 | -4.6 | -2.8 |
| 28 | Southern California | 11.8 | 8.2 | 1.9 | -1.0 | 0.2 | 2.6 |
| 29 | Central Florida | 10.2 | 6.9 | 3.5 | -2.9 | -0.5 | 3.2 |
| 30 | UCLA | 9.3 | 6.2 | 0.0 | 2.8 | 1.5 | -1.2 |
| 31 | Minnesota | 8.5 | 2.4 | 1.0 | 2.5 | -0.4 | 3.0 |
| 32 | West Virginia | 8.3 | 5.5 | 1.8 | -1.9 | 0.0 | 2.9 |
| 33 | Louisiana | 7.9 | 5.2 | -2.6 | 3.8 | 0.5 | 1.1 |
| 34 | Nebraska | 7.9 | 2.5 | 0.0 | 0.0 | 1.6 | 3.7 |
| 35 | Mississippi State | 7.6 | 2.7 | 3.3 | 0.2 | 1.3 | 0.1 |
| 36 | Appalachian State | 7.4 | 3.2 | 1.4 | 2.2 | -0.4 | 0.9 |
| 37 | Arkansas | 7.0 | 3.4 | -1.3 | -0.5 | -1.5 | 6.8 |
| 38 | Wake Forest | 6.9 | 6.2 | 1.5 | 2.8 | -0.9 | -2.7 |
| 39 | Pittsburgh | 6.4 | 5.0 | 0.5 | 1.9 | -0.5 | -0.5 |
| 40 | Boise State | 6.3 | 2.5 | 1.9 | 1.9 | 1.2 | -1.2 |
| 41 | NC State | 6.3 | 2.5 | 1.6 | 1.6 | 1.7 | -1.2 |
| 42 | Virginia Tech | 6.3 | 4.2 | 1.6 | -0.3 | -0.1 | 0.8 |
| 43 | Missouri | 6.1 | 2.0 | 2.0 | -1.4 | 1.6 | 1.8 |
| 44 | Liberty | 5.2 | 2.0 | -1.0 | 3.1 | 0.6 | 0.5 |
| 45 | Coastal Carolina | 5.0 | 8.1 | -3.5 | 1.3 | -2.6 | 1.8 |
| 46 | Boston College | 4.9 | 2.7 | 1.5 | 0.6 | -1.0 | 1.0 |
| 47 | Kentucky | 4.8 | 3.4 | 1.2 | -1.3 | -1.9 | 3.4 |
| 48 | Maryland | 4.6 | 0.6 | -0.2 | 1.6 | 2.5 | 0.1 |
| 49 | Louisville | 4.3 | 4.0 | 0.0 | -3.6 | 1.6 | 2.3 |
| 50 | Purdue | 4.2 | 1.8 | 1.7 | 0.2 | 0.1 | 0.4 |
| 51 | Virginia | 4.2 | 3.6 | 0.4 | -2.0 | 0.4 | 1.8 |
| 52 | Northwestern | 4.2 | 11.9 | 1.8 | -7.0 | -2.4 | -0.1 |
| 53 | Florida State | 4.0 | -5.5 | 1.0 | 0.3 | 0.6 | 7.6 |
| 54 | Brigham Young | 3.9 | 15.7 | -0.9 | -3.8 | -2.4 | -4.7 |
| 55 | Memphis | 3.6 | -1.6 | 1.7 | -1.4 | -0.6 | 5.6 |
| 56 | Tulsa | 3.1 | 6.0 | -1.9 | 0.7 | -0.2 | -1.6 |
| 57 | Kansas State | 3.0 | 1.1 | 1.2 | 0.4 | 0.3 | -0.1 |
| 58 | Houston | 2.9 | 0.0 | 0.1 | 1.0 | 2.4 | -0.7 |
| 59 | California | 2.9 | -0.7 | 0.4 | 2.8 | -0.5 | 0.9 |
| 60 | Baylor | 2.5 | 2.2 | -0.2 | 1.9 | 1.1 | -2.5 |
| 61 | Washington State | 2.1 | -2.0 | 1.9 | 2.1 | 1.4 | -1.3 |
| 62 | Michigan State | 1.8 | -3.2 | 2.0 | -0.2 | 0.5 | 2.7 |
| 63 | Stanford | 1.6 | 2.1 | 2.3 | -0.6 | -0.2 | -2.0 |
| 64 | Colorado | 1.3 | 0.4 | -0.4 | 1.7 | 0.7 | -1.1 |
| 65 | Tulane | 1.1 | 2.3 | -0.7 | 0.1 | -0.8 | 0.2 |
| 66 | Texas Tech | 1.0 | -1.7 | 1.4 | -0.7 | 2.2 | -0.2 |
| 67 | Southern Methodist | 0.9 | 1.0 | -0.6 | -1.6 | 0.1 | 2.1 |
| 68 | Toledo | 0.9 | -0.9 | -0.1 | 3.3 | 2.4 | -3.8 |
| 69 | Georgia Tech | 0.4 | -5.2 | 0.8 | 0.9 | 2.3 | 1.6 |
| 70 | UAB | 0.0 | 0.6 | -1.5 | 0.1 | 1.0 | -0.2 |
| 71 | Nevada | -0.1 | -0.9 | -1.7 | 7.6 | -0.3 | -4.9 |
| 72 | Tennessee | -0.2 | 1.5 | -0.6 | -4.4 | 1.0 | 2.3 |
| 73 | Oregon State | -0.6 | 0.3 | -3.0 | 0.6 | 0.9 | 0.7 |
| 74 | Army | -0.7 | 0.3 | 0.8 | 1.5 | -2.5 | -0.9 |
| 75 | Ball State | -1.5 | 2.4 | -4.6 | 3.1 | -1.5 | -0.9 |
| 76 | San Jose State | -2.2 | 2.5 | -4.7 | 1.8 | -1.2 | -0.7 |
| 77 | Marshall | -2.4 | 2.0 | -0.5 | 1.3 | -1.8 | -3.5 |
| 78 | Wyoming | -2.7 | -1.7 | -0.6 | 4.3 | -1.1 | -3.6 |
| 79 | Troy | -2.7 | -4.0 | -0.1 | -0.1 | 0.7 | 0.9 |
| 80 | South Carolina | -3.5 | -2.5 | 1.4 | -2.9 | 0.9 | -0.5 |
| 81 | Illinois | -3.7 | -3.7 | -2.3 | 2.0 | 0.5 | -0.1 |
| 82 | Rutgers | -3.8 | 0.6 | -2.2 | 4.7 | -0.8 | -6.0 |
| 83 | East Carolina | -4.0 | -3.7 | -4.1 | 2.8 | 1.2 | -0.2 |
| 84 | Buffalo | -4.7 | 5.3 | -0.5 | -2.1 | -1.4 | -6.0 |
| 85 | Western Michigan | -4.8 | -2.3 | -1.1 | 0.5 | 2.0 | -3.8 |
| 86 | Central Michigan | -4.8 | -3.5 | -2.2 | 3.9 | 0.1 | -3.0 |
| 87 | San Diego State | -4.8 | 0.7 | 0.0 | 1.7 | -0.2 | -7.0 |
| 88 | Georgia St. | -5.0 | -3.2 | -3.4 | 4.1 | 0.0 | -2.5 |
| 89 | Ohio | -5.2 | -5.3 | 0.8 | 2.0 | -1.1 | -1.7 |
| 90 | Fresno State | -5.3 | -6.8 | 1.6 | 3.0 | 0.0 | -3.1 |
| 91 | Air Force | -6.3 | 2.2 | -0.4 | -3.2 | -1.1 | -3.9 |
| 92 | Texas-San Antonio | -6.3 | -5.4 | -3.1 | 5.2 | -1.3 | -1.8 |
| 93 | Syracuse | -6.5 | -5.8 | 0.9 | 1.4 | -0.3 | -2.8 |
| 94 | Florida Atlantic | -6.7 | -7.5 | 0.8 | 2.2 | -1.0 | -1.2 |
| 95 | Navy | -7.9 | -8.9 | 0.2 | -1.5 | 0.1 | 2.2 |
| 96 | Duke | -8.0 | -7.1 | 1.3 | -3.8 | 2.3 | -0.7 |
| 97 | Eastern Michigan | -8.0 | -6.2 | -0.9 | 3.6 | -0.9 | -3.7 |
| 98 | South Florida | -8.0 | -10.7 | -0.4 | 3.4 | 1.7 | -2.0 |
| 99 | Georgia Southern | -8.3 | -2.8 | -2.0 | -2.6 | -1.9 | 1.0 |
| 100 | Miami (Ohio) | -9.0 | -3.8 | -1.4 | 2.9 | 0.5 | -7.2 |
| 101 | Kent State | -9.1 | -4.6 | -4.2 | 0.7 | 1.6 | -2.7 |
| 102 | Arizona | -9.4 | -10.7 | 0.3 | -1.0 | 2.5 | -0.4 |
| 103 | Arkansas St. | -9.9 | -7.3 | -0.7 | -5.1 | 0.9 | 2.3 |
| 104 | Rice | -10.3 | -3.6 | -5.0 | 1.4 | -1.0 | -2.1 |
| 105 | Hawaii | -10.5 | -4.9 | -3.0 | 3.0 | 0.5 | -6.0 |
| 106 | Colorado State | -10.7 | -9.8 | -1.7 | 2.4 | 1.5 | -3.2 |
| 107 | Western Kentucky | -10.9 | -9.0 | -2.8 | -3.8 | 0.3 | 4.5 |
| 108 | Southern Miss | -11.2 | -12.9 | -1.3 | 1.8 | 0.9 | 0.3 |
| 109 | Vanderbilt | -12.0 | -10.6 | -0.5 | -0.4 | 2.3 | -2.9 |
| 110 | Louisiana Tech | -13.4 | -10.3 | -1.2 | 1.0 | 0.9 | -3.7 |
| 111 | Middle Tennessee | -14.2 | -14.2 | -1.3 | 0.9 | 1.4 | -0.9 |
| 112 | Texas State | -14.7 | -9.0 | -4.8 | 0.4 | 1.3 | -2.6 |
| 113 | Northern Illinois | -14.9 | -11.8 | -0.7 | 1.0 | 0.4 | -4.0 |
| 114 | Temple | -15.2 | -13.2 | -0.3 | -1.7 | 0.3 | -0.5 |
| 115 | South Alabama | -16.0 | -9.4 | -3.8 | 1.2 | 0.2 | -4.3 |
| 116 | North Texas | -16.5 | -14.9 | -1.2 | -1.4 | 1.2 | -0.2 |
| 117 | Charlotte | -16.6 | -11.1 | -4.1 | -2.6 | -1.0 | 2.2 |
| 118 | New Mexico | -17.8 | -9.8 | -3.3 | 0.1 | -0.8 | -3.9 |
| 119 | Florida International | -18.1 | -15.9 | -1.8 | 1.1 | 0.3 | -1.9 |
| 120 | Utah State | -19.5 | -16.7 | 0.8 | 0.0 | 0.4 | -3.9 |
| 121 | Kansas | -19.7 | -14.0 | -2.6 | -0.4 | 1.6 | -4.2 |
| 122 | Old Dominion | -22.0 | -- | -- | -- | -- | -22.0 |
| 123 | Texas El Paso | -24.9 | -16.2 | -6.0 | 1.6 | 3.3 | -7.7 |
| 124 | Connecticut | -25.9 | -- | -- | -- | -- | -25.9 |
| 125 | UNLV | -26.3 | -17.5 | -2.7 | 3.4 | 1.5 | -11.1 |
| 126 | Akron | -26.4 | -23.3 | -3.1 | 2.9 | 0.7 | -3.6 |
| 127 | UL Monroe | -26.7 | -22.2 | -2.6 | 1.1 | 0.2 | -3.3 |
| 128 | Bowling Green | -31.6 | -29.1 | -4.2 | -1.5 | 3.6 | -0.4 |
| 129 | Massachusetts | -32.3 | -26.7 | -3.5 | 1.1 | 4.3 | -7.5 |
| 130 | New Mexico State | -34.1 | -- | -- | -- | -- | -34.1 |
Note that three teams appearing at the bottom of our rankings have no numbers listed in several columns. Old Dominion, Connecticut, and New Mexico State did not play any games in 2020, so there is no team rating or starter information from last year to use for comparison.
As a result, those three teams are slotted in to the ratings based strictly on the market numbers.
—
If you’re in a college football pool or planning on betting some games this season, check out our Football Pick’em Picks , NFL Survivor Picks, and College Football Betting Picks.