Super Bowl Over/Under Trends: By Total, Pass/Rush Efficiency, Turnover Margin & More
Will Super Bowl LVIII go over or under the total points line? Some stat trends show surprising correlation to Super Bowl over/under results.
January 31, 2024 - by Jason Lisk

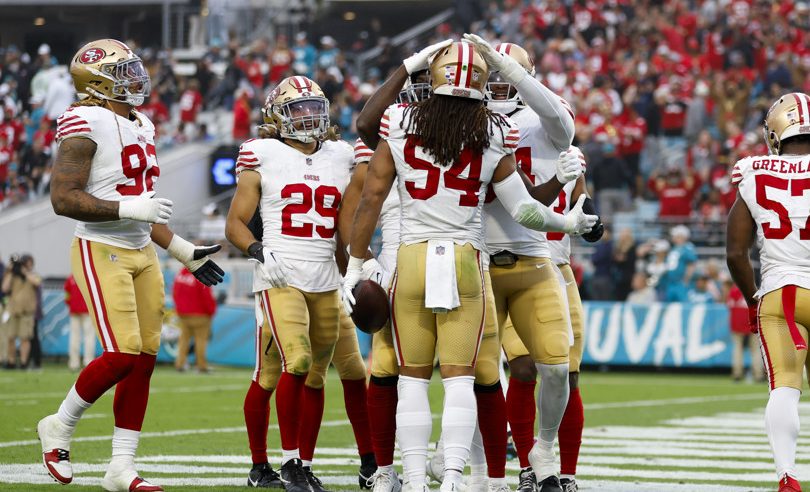
Can the 49ers hold the scoring down? (David Rosenblum/Icon Sportswire)
In this post, we’ll look at historical data trends regarding team performance against the Super Bowl over/under line (also known as the game total or total points line).
While you always need to be cautious when it comes to trend-based analysis, this information can be helpful for making an over/under pick for Super Bowl LVIII in 2024, featuring the Kansas City Chiefs against the San Francisco 49ers.
Analysis Of Historical Super Bowl Over/Under Trends
The trends we will investigate include:
- How many Super Bowls have gone over vs. under the game total line, both overall and at various line values.
- Super Bowl game scoring based on the passing and rushing characteristics of the two teams involved.
- Total scoring in the Super Bowl based on how the opponents ranked in sack rate and turnover margin.
Super Bowl Over/Under Trends By Line Value
Here is a look at the last 28 Super Bowls, and how many games have gone over or under, with some observations below:
| Category | Over | Under | Over Pct |
|---|---|---|---|
| All Point Totals | 14 | 14 | 50.0% |
| O/U of 45 or Below | 4 | 1 | 80.0% |
| O/U of 45.5 to 50 | 6 | 5 | 54.5% |
| O/U Above 50 | 4 | 8 | 33.3% |
| Spread 3 or less | 6 | 4 | 60.0% |
| Spread 3.5 to 6 | 3 | 4 | 42.9% |
| Spread 6.5 or more | 5 | 6 | 45.5% |
- While there have been some streaks, the historical distribution of overs and unders is fairly even over this time period.
- However, the games with the lowest over/under lines have been higher scoring than the games with the highest over/under lines.
- There has not been a strong relationship between the expected total and actual scoring in the Super Bowl in the last 28 years.
Over/Under Trends By Passing and Rushing Stats
Next, let’s dig into several team-level passing and rushing stats to see how these characteristics related to Super Bowl totals and scoring.
Rushing Offense
Here’s a look at performance grouped by the average yards per carry (YPC) of the two Super Bowl teams combined.
While yards per carry is a “noisy” stat that can be skewed by big play luck, it still identifies teams that either made big plays or consistently gained yards versus those that didn’t.
Subscribe now to read the rest...
Plus get picks and tools for betting, NCAA bracket pools and golf pools.
Free access offers available
Already a premium subscriber? Sign in for access