2023 College Basketball Preseason Predictions: Win Totals & Projected Conference Standings
Our 2023 college basketball preseason predictions, including season win totals plus projected conference standings and champion odds.
November 2, 2023 - by Jason Lisk
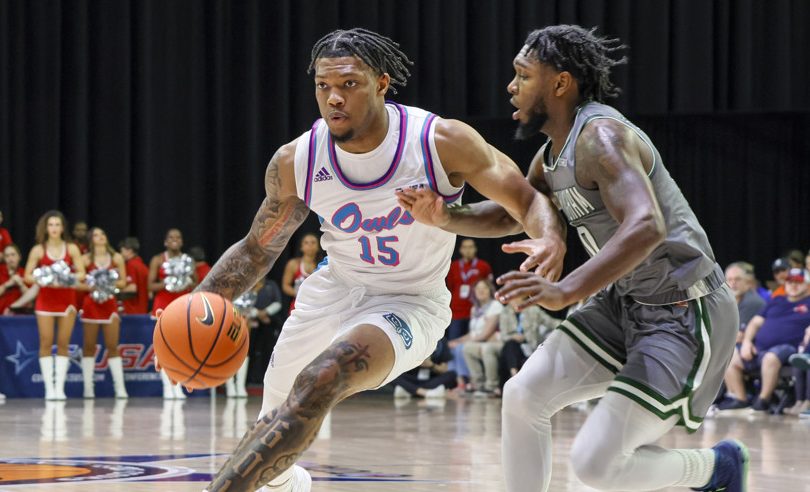
Florida Atlantic and UAB are now part of the American Conference (Matthew Pearce/Icon Sportswire)
Our 2023-24 college basketball preseason predictions are ready, including projected conference standings and season win totals for every team. This post lays out all the projections by conference, and provides some additional context and highlights.
Going forward, you can find our most recent season projections (updated daily) on the college basketball projected standings page on TeamRankings, and also in a big sortable table on the college basketball predictions page on BetIQ.
(Note: All data in this post is from November 2, 2023. During the remaining days of the preseason, the values shown on the site may differ very slightly from the values listed in this post. That’s because we re-run our season projection models every day, and there is always some randomness inherent in the season simulations.)
Preseason Prediction Process & Data
Our preseason projections process contains two primary steps:
- Make preseason team ratings. First, we use a data-driven process to create our 2023 college basketball preseason team ratings. In short, every team is assigned a numerical predictive rating that represents how good we think that team will be this season.
- Run thousands of season simulations. Using our team ratings, we then simulate the outcome of every game in the upcoming 2023-24 college basketball season. Then we do it again, thousands more times, and average out all of the simulation results.
A wide variety of projections data results from the process above, and we list the biggest takeaways in the individual conference tables below, including:
-
- Full conference standings projections
- Projected regular-season records
- Conference win odds (regular season)
- Conference tournament win odds
But before we dive into the conference-by-conference analysis, let’s point out a few projections highlights for the 2023-24 season.
Projections Highlights: Conference Winner Odds
Here are our projected regular-season winners for all conferences that had at least one at-large team selected in last year’s NCAA tournament, along with their respective odds to be conference champs:
- American: Florida Atlantic (48%)
- ACC: Duke (44%)
- Big 12: Kansas (27%)
- Big East: Connecticut (25%)
- Big Ten: Purdue (32%)
- Mountain West: San Diego State (32%)
- Pac-12: USC (23%)
- SEC: Tennessee (25%)
- WCC: Gonzaga (55%)
Some observations here:
- Last season, in what looked like a balanced year in the preseason, you would have expected only 3.40 of our projected conference champs in these same nine conferences to actually win the conference. Four actually did (Arizona, Gonzaga, Houston, and San Diego State).
- This year, you would expect only 3.02 of these teams, or one-third of them, to actually win the regular season title, as there is even more parity (even Gonzaga’s odds are lower than they typically have been).
- We’ve had some conference re-alignment, and only four teams are projected as the favorite to repeat as champions from a year ago: Gonzaga, Kansas, Purdue, and San Diego State.
- USC is our favorite in the Pac-12, but at 23 percent, it has the shortest odds of any of these projected conference winners.
- Florida Atlantic is the favorite in the new-look American Athletic Conference, over the team they beat in the first round of the NCAA Tournament, Memphis.
Biggest Mid-Major Conference Favorites
Last year, there were five teams from one-bid conferences projected with 49% or higher odds to win the regular season title. This year, there are only two. Here are the biggest favorites among the mid-majors:
- Colgate (69% to win Patriot)
- Yale (55% to win the Ivy League)
- Vermont (46% to win America East)
- Furman (40% to win Southern Conference)
- Drake (39% to win the MVC)
- Iona (39% to win the MAAC)
Colgate has our highest regular-season conference champion odds overall, after being the second-biggest conference favorite a year ago, behind Gonzaga.
2023-24 College Basketball Projected Conference Standings
For a lot more info on any team, click their name in the associated conference table below to view their season projections page. Once there, be sure to also check out the team Bracketology link at the top of the page.
Other than that, just keep in mind the following two notes:
- Scheduled games only. Our preseason win-loss record projections only account for already scheduled games, so they will be missing some early-season tournament games where opponents have yet to be determined.
- Pandemic-related schedule impacts. Team schedules hopefully will not change nearly as frequently as they did in the past few seasons for COVID-19 outbreaks, but some games still might be canceled or postponed in the future. So, some of the win-loss records below are bound to be wrong in terms of number of actual games played. We will not be updating this post in the future; see our college basketball projections page for the latest projections we have.
- Daily variance. Even before the season starts, the numbers here may differ slightly from those on the college basketball projections pages on TeamRankings and BetIQ. That isn’t us adjusting numbers behind the scenes; it’s just the result of variance in our season simulations which rerun daily, even in the preseason.
Table Key
- CONFERENCE: Projected conference wins and losses during the regular season.
- OVERALL: Projected total wins and losses during the regular season.
- CONFERENCE ODDS: Odds to win the regular season conference title (Reg), odds to win the conference tournament (Tourn)
2023-24 ACC Basketball Projected Standings
| Conference | Overall | Conference Odds | ||||
|---|---|---|---|---|---|---|
| Team | W | L | W | L | Reg | Tourn |
| Duke | 15.8 | 4.2 | 24.9 | 6.1 | 43.6% | 33.3% |
| Virginia | 12.7 | 7.3 | 20.4 | 9.6 | 10.0% | 10.0% |
| N Carolina | 12.7 | 7.3 | 19.3 | 9.7 | 11.9% | 13.8% |
| Miami | 12.4 | 7.6 | 20.4 | 9.6 | 8.8% | 9.5% |
| Clemson | 12.3 | 7.7 | 19.4 | 10.6 | 8.0% | 10.0% |
| VA Tech | 11.4 | 8.6 | 18.3 | 10.7 | 5.2% | 5.8% |
| NC State | 11.4 | 8.6 | 19.1 | 10.9 | 5.6% | 6.0% |
| Pittsburgh | 10.2 | 9.8 | 18.1 | 11.9 | 2.8% | 4.0% |
| Florida St | 9.5 | 10.5 | 16.8 | 13.2 | 1.9% | 2.9% |
| GA Tech | 8.4 | 11.6 | 14.0 | 15.0 | 0.7% | 1.4% |
| Wake Forest | 8.3 | 11.7 | 14.7 | 14.3 | 0.8% | 1.7% |
| Syracuse | 7.9 | 12.1 | 13.0 | 16.0 | 0.5% | 1.0% |
| Boston Col | 6.4 | 13.6 | 12.7 | 17.3 | 0.1% | 0.3% |
| Louisville | 6.0 | 14.0 | 11.9 | 18.1 | 0.0% | 0.3% |
| Notre Dame | 4.6 | 15.4 | 10.0 | 20.0 | 0.0% | 0.1% |
2023-24 America East Basketball Projected Standings
| Conference | Overall | Conference Odds | ||||
|---|---|---|---|---|---|---|
| Team | W | L | W | L | Reg | Tourn |
| Vermont | 12.1 | 3.9 | 20.1 | 8.9 | 45.6% | 42.3% |
| Mass Lowell | 10.5 | 5.5 | 19.3 | 9.7 | 22.2% | 21.9% |
| Bryant | 10.1 | 5.9 | 17.2 | 13.8 | 17.7% | 17.9% |
| Maryland BC | 8.0 | 8.0 | 15.7 | 15.3 | 5.2% | 6.0% |
| Maine | 7.3 | 8.7 | 14.2 | 16.8 | 3.6% | 4.2% |
| N Hampshire | 6.7 | 9.3 | 11.9 | 17.1 | 2.3% | 2.9% |
| Binghamton | 6.5 | 9.5 | 12.4 | 16.6 | 1.7% | 2.4% |
| Albany | 5.6 | 10.4 | 10.9 | 20.1 | 0.9% | 1.4% |
| NJIT | 5.3 | 10.7 | 9.7 | 18.3 | 0.8% | 1.1% |
2023-24 AAC Basketball Projected Standings
| Conference | Overall | Conference Odds | ||||
|---|---|---|---|---|---|---|
| Team | W | L | W | L | Reg | Tourn |
| Fla Atlantic | 14.2 | 3.8 | 22.6 | 6.4 | 47.6% | 39.0% |
| Memphis | 12.8 | 5.2 | 19.8 | 9.2 | 26.3% | 24.7% |
| Wichita St | 9.8 | 8.2 | 16.6 | 12.4 | 4.5% | 5.9% |
| S Methodist | 9.4 | 8.6 | 17.2 | 12.8 | 3.3% | 5.1% |
| Tulane | 9.2 | 8.8 | 17.3 | 11.7 | 3.7% | 5.1% |
| UAB | 9.1 | 8.9 | 17.1 | 12.9 | 3.8% | 5.1% |
| S Florida | 9.1 | 8.9 | 16.6 | 12.4 | 2.6% | 2.8% |
| North Texas | 8.9 | 9.1 | 15.5 | 12.5 | 2.8% | 4.1% |
| Temple | 8.5 | 9.5 | 14.6 | 13.4 | 1.5% | 2.3% |
| E Carolina | 8.3 | 9.7 | 17.6 | 13.4 | 1.4% | 2.3% |
| Charlotte | 8.2 | 9.8 | 14.3 | 14.7 | 1.2% | 1.6% |
| Rice | 8.2 | 9.8 | 15.8 | 15.2 | 1.2% | 1.6% |
| Tulsa | 5.5 | 12.5 | 12.5 | 17.5 | 0.1% | 0.3% |
| UTSA | 4.7 | 13.3 | 12.2 | 18.8 | 0.0% | 0.1% |
2023-24 ASUN Basketball Projected Standings
| Conference | Overall | Conference Odds | ||||
|---|---|---|---|---|---|---|
| Team | W | L | W | L | Reg | Tourn |
| E Kentucky | 10.6 | 5.4 | 19.4 | 10.6 | 25.4% | 23.8% |
| Fla Gulf Cst | 10.0 | 6.0 | 16.3 | 12.7 | 18.7% | 17.3% |
| Lipscomb | 9.5 | 6.5 | 17.2 | 13.8 | 12.9% | 13.5% |
| Bellarmine | 8.4 | 7.6 | 15.3 | 15.7 | 7.2% | 8.0% |
| Stetson | 8.3 | 7.7 | 15.4 | 15.6 | 8.1% | 7.6% |
| Austin Peay | 8.1 | 7.9 | 15.0 | 15.0 | 6.2% | 6.6% |
| N Alabama | 7.9 | 8.1 | 14.8 | 15.2 | 6.1% | 6.4% |
| Kennesaw St | 7.7 | 8.3 | 14.5 | 15.5 | 4.9% | 5.0% |
| Queens | 7.6 | 8.4 | 14.1 | 16.9 | 4.7% | 5.0% |
| Jacksonville | 7.3 | 8.7 | 14.5 | 15.5 | 3.3% | 3.8% |
| N Florida | 6.6 | 9.4 | 14.3 | 16.7 | 2.1% | 2.6% |
| Central Ark | 4.1 | 11.9 | 9.8 | 22.2 | 0.3% | 0.4% |
2023-24 Atlantic 10 Basketball Projected Standings
| Conference | Overall | Conference Odds | ||||
|---|---|---|---|---|---|---|
| Team | W | L | W | L | Reg | Tourn |
| Dayton | 12.9 | 5.1 | 20.8 | 8.2 | 29.0% | 25.5% |
| St Bonavent | 12.2 | 5.8 | 20.6 | 8.4 | 20.8% | 18.2% |
| Loyola-Chi | 11.0 | 7.0 | 20.0 | 10.0 | 11.5% | 10.6% |
| Duquesne | 10.6 | 7.4 | 19.6 | 11.4 | 9.6% | 10.4% |
| Richmond | 9.8 | 8.2 | 17.3 | 12.7 | 6.0% | 6.1% |
| VCU | 9.8 | 8.2 | 17.5 | 11.5 | 6.9% | 7.9% |
| Saint Louis | 9.3 | 8.7 | 16.2 | 12.8 | 4.2% | 5.7% |
| Geo Mason | 8.6 | 9.4 | 16.3 | 13.7 | 3.1% | 3.3% |
| Davidson | 8.4 | 9.6 | 15.0 | 14.0 | 2.4% | 3.6% |
| St Josephs | 8.4 | 9.6 | 15.6 | 14.4 | 2.5% | 3.0% |
| U Mass | 7.9 | 10.1 | 13.7 | 14.3 | 1.5% | 1.9% |
| Fordham | 7.4 | 10.6 | 14.5 | 14.5 | 1.1% | 1.8% |
| Rhode Island | 6.9 | 11.1 | 13.3 | 16.7 | 0.7% | 1.0% |
| La Salle | 6.5 | 11.5 | 13.3 | 16.7 | 0.5% | 0.8% |
| Geo Wshgtn | 5.4 | 12.6 | 12.2 | 16.8 | 0.2% | 0.3% |
2023-24 Big 12 Basketball Projected Standings
| Conference | Overall | Conference Odds | ||||
|---|---|---|---|---|---|---|
| Team | W | L | W | L | Reg | Tourn |
| Kansas | 12.3 | 5.7 | 21.8 | 7.2 | 26.5% | 21.6% |
| Houston | 11.4 | 6.6 | 21.2 | 7.8 | 16.5% | 15.7% |
| Texas | 10.5 | 7.5 | 21.1 | 8.9 | 10.3% | 11.0% |
| Baylor | 9.8 | 8.2 | 19.5 | 10.5 | 8.9% | 9.3% |
| TX Christian | 9.8 | 8.2 | 19.5 | 9.5 | 7.6% | 7.9% |
| BYU | 9.6 | 8.4 | 19.9 | 10.1 | 6.7% | 6.6% |
| Texas Tech | 9.6 | 8.4 | 19.0 | 10.0 | 7.1% | 6.9% |
| Iowa St | 8.7 | 9.3 | 18.6 | 10.4 | 4.1% | 5.1% |
| Kansas St | 8.7 | 9.3 | 17.6 | 12.4 | 3.9% | 4.8% |
| Cincinnati | 8.5 | 9.5 | 19.4 | 11.6 | 3.2% | 3.8% |
| Oklahoma | 8.2 | 9.8 | 17.8 | 12.2 | 3.0% | 3.8% |
| W Virginia | 6.9 | 11.1 | 15.8 | 14.2 | 1.0% | 1.6% |
| Oklahoma St | 6.6 | 11.4 | 16.3 | 13.7 | 1.0% | 1.5% |
| UCF | 5.3 | 12.7 | 13.5 | 15.5 | 0.3% | 0.5% |
2023-24 Big East Basketball Projected Standings
| Conference | Overall | Conference Odds | ||||
|---|---|---|---|---|---|---|
| Team | W | L | W | L | Reg | Tourn |
| Connecticut | 13.7 | 6.3 | 21.7 | 8.3 | 24.6% | 21.5% |
| Creighton | 13.5 | 6.5 | 21.7 | 8.3 | 22.0% | 20.1% |
| Marquette | 13.5 | 6.5 | 20.5 | 8.5 | 22.4% | 20.3% |
| Villanova | 12.1 | 7.9 | 18.0 | 10.0 | 11.5% | 12.4% |
| Xavier | 11.0 | 9.0 | 18.5 | 11.5 | 6.3% | 8.0% |
| Providence | 10.6 | 9.4 | 18.6 | 11.4 | 5.7% | 6.8% |
| St Johns | 10.4 | 9.6 | 17.4 | 11.6 | 4.9% | 6.3% |
| Seton Hall | 9.0 | 11.0 | 16.1 | 13.9 | 2.2% | 3.5% |
| Butler | 5.6 | 14.4 | 11.3 | 17.7 | 0.2% | 0.5% |
| Georgetown | 5.6 | 14.4 | 13.3 | 17.7 | 0.2% | 0.5% |
| DePaul | 4.9 | 15.1 | 10.6 | 19.4 | 0.1% | 0.3% |
2023-24 Big Sky Basketball Projected Standings
| Conference | Overall | Conference Odds | ||||
|---|---|---|---|---|---|---|
| Team | W | L | W | L | Reg | Tourn |
| E Washingtn | 11.8 | 6.2 | 17.3 | 13.7 | 25.3% | 21.9% |
| Weber St | 11.7 | 6.3 | 19.0 | 12.0 | 24.5% | 21.4% |
| Montana | 11.1 | 6.9 | 18.3 | 12.7 | 19.5% | 17.7% |
| Portland St | 9.2 | 8.8 | 16.2 | 14.8 | 6.5% | 8.2% |
| N Arizona | 8.8 | 9.2 | 13.5 | 17.5 | 6.0% | 7.0% |
| N Colorado | 8.7 | 9.3 | 15.2 | 14.8 | 5.2% | 7.0% |
| Montana St | 8.7 | 9.3 | 15.8 | 15.2 | 5.5% | 6.8% |
| Sac State | 8.5 | 9.5 | 13.8 | 16.2 | 5.2% | 6.4% |
| Idaho St | 7.0 | 11.0 | 12.9 | 18.1 | 2.0% | 3.1% |
| Idaho | 4.6 | 13.4 | 9.6 | 21.4 | 0.3% | 0.7% |
2023-24 Big South Basketball Projected Standings
| Conference | Overall | Conference Odds | ||||
|---|---|---|---|---|---|---|
| Team | W | L | W | L | Reg | Tourn |
| Winthrop | 10.5 | 5.5 | 19.4 | 11.6 | 25.7% | 22.6% |
| NC-Asheville | 10.4 | 5.6 | 19.1 | 11.9 | 24.1% | 21.7% |
| Radford | 10.1 | 5.9 | 17.7 | 12.3 | 21.9% | 19.9% |
| Gard-Webb | 9.3 | 6.7 | 17.2 | 14.8 | 13.8% | 14.4% |
| Longwood | 8.3 | 7.7 | 18.2 | 12.8 | 7.2% | 9.1% |
| SC Upstate | 6.9 | 9.1 | 12.7 | 16.3 | 3.6% | 5.2% |
| High Point | 6.3 | 9.7 | 12.6 | 16.4 | 2.0% | 3.5% |
| Presbyterian | 5.2 | 10.8 | 12.6 | 18.4 | 0.9% | 1.8% |
| Charl South | 5.1 | 10.9 | 10.8 | 18.2 | 0.9% | 1.7% |
2023-24 Big Ten Basketball Projected Standings
| Conference | Overall | Conference Odds | ||||
|---|---|---|---|---|---|---|
| Team | W | L | W | L | Reg | Tourn |
| Purdue | 14.3 | 5.7 | 21.9 | 7.1 | 31.8% | 26.3% |
| Michigan St | 13.5 | 6.5 | 22.9 | 8.1 | 21.1% | 18.6% |
| Illinois | 11.7 | 8.3 | 20.7 | 10.3 | 9.7% | 11.2% |
| Wisconsin | 11.4 | 8.6 | 18.7 | 11.3 | 9.5% | 9.2% |
| Maryland | 11.0 | 9.0 | 19.4 | 10.6 | 7.0% | 7.5% |
| Ohio St | 10.5 | 9.5 | 18.3 | 11.7 | 4.5% | 4.7% |
| Northwestern | 10.2 | 9.8 | 19.0 | 11.0 | 4.6% | 5.4% |
| Iowa | 10.1 | 9.9 | 18.0 | 12.0 | 3.2% | 4.7% |
| Indiana | 9.2 | 10.8 | 16.6 | 13.4 | 2.3% | 3.1% |
| Rutgers | 9.2 | 10.8 | 18.0 | 13.0 | 2.3% | 3.5% |
| Michigan | 8.9 | 11.1 | 15.1 | 13.9 | 2.3% | 3.1% |
| Nebraska | 8.1 | 11.9 | 16.7 | 14.3 | 1.2% | 1.6% |
| Penn St | 6.8 | 13.2 | 14.2 | 14.8 | 0.6% | 0.9% |
| Minnesota | 5.1 | 14.9 | 13.7 | 17.3 | 0.1% | 0.2% |
2023-24 Big West Basketball Projected Standings
| Conference | Overall | Conference Odds | ||||
|---|---|---|---|---|---|---|
| Team | W | L | W | L | Reg | Tourn |
| UC Irvine | 13.6 | 6.4 | 19.7 | 12.3 | 26.1% | 23.7% |
| UCSB | 12.5 | 7.5 | 19.2 | 10.8 | 16.0% | 16.0% |
| Lg Beach St | 12.3 | 7.7 | 17.5 | 12.5 | 15.7% | 15.5% |
| Hawaii | 11.9 | 8.1 | 17.5 | 10.5 | 12.1% | 12.9% |
| UC Davis | 11.7 | 8.3 | 18.4 | 12.6 | 11.2% | 12.0% |
| CS Fullerton | 11.5 | 8.5 | 16.6 | 14.4 | 11.0% | 11.2% |
| UC Riverside | 10.0 | 10.0 | 16.1 | 15.9 | 5.0% | 6.0% |
| UCSD | 8.2 | 11.8 | 14.2 | 17.8 | 1.3% | 0.0% |
| CS Bakersfld | 8.0 | 12.0 | 12.6 | 17.4 | 1.4% | 2.1% |
| Cal St Nrdge | 5.4 | 14.6 | 11.1 | 20.9 | 0.1% | 0.4% |
| Cal Poly | 4.9 | 15.1 | 8.9 | 23.1 | 0.1% | 0.2% |
2023-24 CAA Basketball Projected Standings
| Conference | Overall | Conference Odds | ||||
|---|---|---|---|---|---|---|
| Team | W | L | W | L | Reg | Tourn |
| Hofstra | 13.3 | 4.7 | 19.7 | 9.3 | 28.1% | 24.6% |
| Col Charlestn | 13.3 | 4.7 | 20.5 | 8.5 | 28.5% | 26.3% |
| Drexel | 12.1 | 5.9 | 19.6 | 10.4 | 13.6% | 14.3% |
| NC-Wilmgton | 11.7 | 6.3 | 18.1 | 11.9 | 12.6% | 12.7% |
| Towson | 10.6 | 7.4 | 17.0 | 12.0 | 6.1% | 7.4% |
| Delaware | 10.5 | 7.5 | 16.7 | 12.3 | 5.7% | 6.4% |
| Northeastrn | 9.1 | 8.9 | 14.1 | 16.9 | 2.5% | 3.2% |
| Stony Brook | 8.3 | 9.7 | 13.7 | 17.3 | 1.3% | 2.0% |
| Campbell | 7.7 | 10.3 | 15.2 | 15.8 | 0.8% | 1.3% |
| Elon | 6.8 | 11.2 | 12.5 | 18.5 | 0.3% | 0.6% |
| Wm & Mary | 6.3 | 11.7 | 11.9 | 19.1 | 0.3% | 0.5% |
| Hampton | 6.1 | 11.9 | 10.6 | 18.4 | 0.2% | 0.3% |
| Monmouth | 5.4 | 12.6 | 8.6 | 22.4 | 0.1% | 0.2% |
| NC A&T | 4.8 | 13.2 | 8.0 | 23.0 | 0.0% | 0.1% |
2023-24 Conference USA Basketball Projected Standings
| Conference | Overall | Conference Odds | ||||
|---|---|---|---|---|---|---|
| Team | W | L | W | L | Reg | Tourn |
| Liberty | 10.7 | 5.3 | 20.1 | 8.9 | 33.6% | 27.5% |
| Sam Hous St | 9.3 | 6.7 | 18.1 | 12.9 | 17.2% | 16.4% |
| LA Tech | 9.1 | 6.9 | 18.9 | 12.1 | 14.8% | 14.6% |
| W Kentucky | 8.1 | 7.9 | 17.1 | 12.9 | 9.3% | 10.0% |
| N Mex State | 7.8 | 8.2 | 15.7 | 14.3 | 7.0% | 8.5% |
| Middle Tenn | 7.7 | 8.3 | 15.6 | 13.4 | 7.4% | 8.4% |
| TX El Paso | 7.5 | 8.5 | 15.9 | 13.1 | 6.0% | 7.3% |
| Florida Intl | 6.8 | 9.2 | 14.1 | 14.9 | 4.0% | 5.3% |
| Jksnville St | 4.9 | 11.1 | 13.2 | 17.8 | 0.8% | 2.0% |
2023-24 Horizon League Basketball Projected Standings
| Conference | Overall | Conference Odds | |||||
|---|---|---|---|---|---|---|---|
| Team | W | L | W | L | Reg | Tourn | |
| Wright St | 13.7 | 6.3 | 19.0 | 10.0 | 26.2% | 23.6% | |
| Cleveland St | 13.6 | 6.4 | 20.2 | 10.8 | 24.9% | 22.6% | |
| Youngs St | 12.8 | 7.2 | 20.1 | 10.9 | 17.9% | 17.3% | |
| N Kentucky | 12.0 | 8.0 | 17.5 | 13.5 | 12.3% | 12.9% | |
| WI-Milwkee | 11.5 | 8.5 | 16.7 | 13.3 | 9.7% | 10.6% | |
| Oakland | 8.8 | 11.2 | 10.4 | 18.6 | 2.4% | 3.3% | |
| Detroit | 8.6 | 11.4 | 11.2 | 19.8 | 2.2% | 2.9% | |
| Rob Morris | 8.5 | 11.5 | 13.8 | 17.2 | 2.0% | 2.9% | |
| IPFW | 8.5 | 11.5 | 13.8 | 16.2 | 1.9% | 2.8% | |
| WI-Grn Bay | 6.0 | 14.0 | 10.2 | 20.8 | 0.3% | 0.6% | |
| IUPUI | 6.0 | 14.0 | 11.4 | 19.6 | 0.3% | 0.6% | |
2023-24 Independents Basketball Projections
| Overall | ||
|---|---|---|
| Team | W | L |
| Chicago St | 10.8 | 18.2 |
2023-24 Ivy League Basketball Projected Standings
| Conference | Overall | Conference Odds | ||||
|---|---|---|---|---|---|---|
| Team | W | L | W | L | Reg | Tourn |
| Yale | 10.8 | 3.2 | 20.6 | 8.4 | 54.8% | 41.7% |
| Princeton | 8.5 | 5.5 | 16.0 | 11.0 | 16.5% | 25.9% |
| Cornell | 8.3 | 5.7 | 15.9 | 11.1 | 14.3% | 14.2% |
| Brown | 6.7 | 7.3 | 12.9 | 14.1 | 5.0% | 6.0% |
| U Penn | 6.5 | 7.5 | 13.7 | 14.3 | 4.2% | 5.1% |
| Harvard | 6.1 | 7.9 | 12.3 | 14.7 | 3.1% | 4.0% |
| Dartmouth | 5.2 | 8.8 | 11.6 | 15.4 | 1.6% | 2.3% |
| Columbia | 4.1 | 9.9 | 11.4 | 15.6 | 0.5% | 0.8% |
2023-24 MAAC Basketball Projected Standings
| Conference | Overall | Conference Odds | ||||
|---|---|---|---|---|---|---|
| Team | W | L | W | L | Reg | Tourn |
| Iona | 14.2 | 5.8 | 19.1 | 9.9 | 39.3% | 30.4% |
| Quinnipiac | 11.3 | 8.7 | 17.6 | 13.4 | 11.9% | 12.2% |
| Rider | 11.2 | 8.8 | 15.4 | 15.6 | 11.6% | 11.6% |
| Siena | 10.4 | 9.6 | 14.7 | 15.3 | 7.9% | 8.8% |
| Niagara | 9.9 | 10.1 | 14.4 | 14.6 | 6.1% | 7.2% |
| Canisius | 9.7 | 10.3 | 13.3 | 16.7 | 5.5% | 6.6% |
| Mt St Marys | 9.4 | 10.6 | 13.8 | 17.2 | 4.8% | 5.9% |
| St Peters | 9.0 | 11.0 | 12.6 | 16.4 | 4.1% | 5.2% |
| Fairfield | 9.0 | 11.0 | 14.0 | 17.0 | 4.1% | 5.2% |
| Marist | 9.0 | 11.0 | 13.1 | 15.9 | 3.8% | 4.9% |
| Manhattan | 6.9 | 13.1 | 10.1 | 18.9 | 0.9% | 2.0% |
2023-24 MAC Basketball Projected Standings
| Conference | Overall | Conference Odds | ||||
|---|---|---|---|---|---|---|
| Team | W | L | W | L | Reg | Tourn |
| Kent St | 12.9 | 5.1 | 19.2 | 8.8 | 29.4% | 26.5% |
| Akron | 12.6 | 5.4 | 19.0 | 9.0 | 25.6% | 22.5% |
| Ohio | 11.7 | 6.3 | 18.7 | 9.3 | 17.2% | 17.9% |
| Toledo | 11.1 | 6.9 | 17.3 | 12.7 | 13.2% | 14.1% |
| Bowling Grn | 9.6 | 8.4 | 17.7 | 12.3 | 4.7% | 5.2% |
| Ball St | 9.2 | 8.8 | 16.6 | 13.4 | 3.8% | 4.1% |
| Miami (OH) | 8.3 | 9.7 | 14.0 | 16.0 | 2.1% | 2.8% |
| Buffalo | 8.0 | 10.0 | 12.4 | 15.6 | 1.9% | 3.1% |
| N Illinois | 7.3 | 10.7 | 12.1 | 17.9 | 1.5% | 2.3% |
| E Michigan | 6.3 | 11.7 | 11.6 | 18.4 | 0.4% | 0.7% |
| W Michigan | 5.7 | 12.3 | 9.1 | 19.9 | 0.2% | 0.5% |
| Central Mich | 5.3 | 12.7 | 8.5 | 20.5 | 0.1% | 0.3% |
2023-24 MEAC Basketball Projected Standings
| Conference | Overall | Conference Odds | ||||
|---|---|---|---|---|---|---|
| Team | W | L | W | L | Reg | Tourn |
| Norfolk St | 9.6 | 4.4 | 17.2 | 10.8 | 37.3% | 30.4% |
| NC Central | 8.2 | 5.8 | 15.9 | 13.1 | 18.3% | 17.5% |
| Howard | 8.1 | 4.9 | 15.4 | 14.6 | 22.0% | 23.1% |
| Morgan St | 6.5 | 7.5 | 12.0 | 17.0 | 6.7% | 7.8% |
| Maryland ES | 6.1 | 6.9 | 12.4 | 15.6 | 6.0% | 7.2% |
| Delaware St | 5.6 | 8.4 | 11.1 | 18.9 | 3.6% | 5.1% |
| Coppin St | 5.5 | 8.5 | 8.1 | 19.9 | 3.1% | 4.5% |
| S Car State | 5.4 | 8.6 | 10.2 | 20.8 | 3.1% | 4.4% |
2023-24 Mountain West Basketball Projected Standings
| Conference | Overall | Conference Odds | ||||
|---|---|---|---|---|---|---|
| Team | W | L | W | L | Reg | Tourn |
| San Diego St | 12.7 | 5.3 | 21.5 | 8.5 | 31.6% | 26.0% |
| Boise St | 11.7 | 6.3 | 19.8 | 9.2 | 20.0% | 16.7% |
| Nevada | 11.0 | 7.0 | 20.2 | 9.8 | 14.2% | 13.2% |
| New Mexico | 10.9 | 7.1 | 20.7 | 10.3 | 13.4% | 12.5% |
| UNLV | 10.3 | 7.7 | 17.0 | 12.0 | 7.6% | 15.7% |
| Utah St | 9.8 | 8.2 | 17.6 | 11.4 | 6.3% | 6.5% |
| Colorado St | 8.8 | 9.2 | 16.8 | 13.2 | 4.3% | 5.4% |
| Fresno St | 7.6 | 10.4 | 15.5 | 14.5 | 1.6% | 2.4% |
| Air Force | 6.2 | 11.8 | 14.4 | 15.6 | 0.6% | 0.9% |
| San Jose St | 5.2 | 12.8 | 11.1 | 17.9 | 0.3% | 0.5% |
| Wyoming | 4.7 | 13.3 | 9.4 | 18.6 | 0.2% | 0.3% |
2023-24 Missouri Valley Basketball Projected Standings
| Conference | Overall | Conference Odds | ||||
|---|---|---|---|---|---|---|
| Team | W | L | W | L | Reg | Tourn |
| Drake | 14.9 | 5.1 | 22.2 | 6.8 | 38.5% | 30.3% |
| Indiana St | 13.0 | 7.0 | 20.3 | 10.7 | 15.0% | 14.7% |
| Bradley | 12.9 | 7.1 | 19.3 | 10.7 | 15.8% | 15.5% |
| N Iowa | 11.9 | 8.1 | 17.3 | 11.7 | 9.6% | 10.1% |
| Murray St | 11.2 | 8.8 | 18.0 | 13.0 | 5.9% | 7.7% |
| Missouri St | 11.0 | 9.0 | 15.9 | 13.1 | 6.2% | 7.7% |
| Belmont | 10.4 | 9.6 | 16.6 | 14.4 | 4.3% | 6.1% |
| S Illinois | 9.9 | 10.1 | 16.1 | 13.9 | 3.0% | 4.6% |
| Illinois St | 8.7 | 11.3 | 13.7 | 15.3 | 1.5% | 2.3% |
| IL-Chicago | 6.8 | 13.2 | 11.5 | 17.5 | 0.3% | 0.7% |
| Valparaiso | 5.3 | 14.7 | 10.7 | 20.4 | 0.1% | 0.2% |
| Evansville | 3.9 | 16.1 | 7.7 | 23.3 | 0.0% | 0.1% |
2023-24 NEC Basketball Projected Standings
| Conference | Overall | Conference Odds | ||||
|---|---|---|---|---|---|---|
| Team | W | L | W | L | Reg | Tourn |
| Wagner | 10.1 | 5.9 | 15.9 | 12.1 | 25.8% | 24.6% |
| Sacred Hrt | 9.7 | 6.3 | 16.9 | 14.1 | 21.6% | 20.3% |
| Central Conn | 8.6 | 7.4 | 14.0 | 15.0 | 12.4% | 12.7% |
| Stonehill | 8.3 | 7.7 | 12.4 | 18.6 | 10.3% | 10.4% |
| F Dickinson | 8.2 | 7.8 | 14.4 | 16.6 | 9.9% | 10.3% |
| Merrimack | 8.0 | 8.0 | 13.0 | 17.0 | 9.6% | 10.2% |
| St Fran (PA) | 7.4 | 8.6 | 11.7 | 17.3 | 6.1% | 6.1% |
| Le Moyne | 6.1 | 9.9 | 10.7 | 19.3 | 2.7% | 3.2% |
| LIU | 5.6 | 10.4 | 8.1 | 20.9 | 1.7% | 2.1% |
2023-24 Ohio Valley Basketball Projected Standings
| Conference | Overall | Conference Odds | ||||
|---|---|---|---|---|---|---|
| Team | W | L | W | L | Reg | Tourn |
| Morehead St | 11.0 | 7.0 | 17.4 | 13.6 | 20.1% | 18.8% |
| SIU Edward | 10.5 | 7.5 | 17.2 | 13.8 | 15.5% | 14.5% |
| TN Martin | 10.0 | 8.0 | 17.1 | 13.9 | 12.6% | 12.4% |
| TN State | 9.8 | 8.2 | 16.0 | 14.0 | 11.8% | 11.5% |
| AR Lit Rock | 9.7 | 8.3 | 15.4 | 15.6 | 11.0% | 10.8% |
| W Illinois | 8.8 | 9.2 | 15.7 | 15.3 | 6.9% | 7.2% |
| SE Missouri | 8.6 | 9.4 | 15.9 | 15.1 | 7.0% | 7.1% |
| E Illinois | 8.6 | 9.4 | 15.2 | 15.8 | 6.7% | 7.1% |
| TN Tech | 8.3 | 9.7 | 14.1 | 16.9 | 4.8% | 6.0% |
| S Indiana | 7.0 | 11.0 | 12.1 | 18.9 | 2.1% | 2.7% |
| Lindenwood | 6.5 | 11.5 | 11.9 | 19.1 | 1.5% | 2.0% |
2023-24 Pac-12 Basketball Projected Standings
| Conference | Overall | Conference Odds | ||||
|---|---|---|---|---|---|---|
| Team | W | L | W | L | Reg | Tourn |
| USC | 13.6 | 6.4 | 21.5 | 8.5 | 23.3% | 20.5% |
| Arizona | 13.2 | 6.8 | 20.8 | 10.2 | 21.2% | 19.1% |
| Colorado | 12.6 | 7.4 | 21.3 | 8.7 | 14.2% | 13.7% |
| Oregon | 12.3 | 7.7 | 20.8 | 9.2 | 12.8% | 13.0% |
| UCLA | 11.5 | 8.5 | 18.2 | 10.8 | 9.3% | 9.5% |
| Stanford | 11.2 | 8.8 | 17.5 | 10.5 | 7.7% | 8.2% |
| Washington | 10.4 | 9.6 | 17.6 | 12.4 | 4.6% | 5.4% |
| Utah | 10.0 | 10.0 | 16.7 | 12.3 | 4.1% | 5.5% |
| Arizona St | 8.9 | 11.1 | 15.1 | 14.9 | 1.9% | 3.2% |
| Wash State | 7.7 | 12.3 | 15.1 | 14.9 | 0.9% | 1.6% |
| Oregon St | 4.3 | 15.7 | 10.8 | 19.2 | 0.0% | 0.2% |
| California | 4.2 | 15.8 | 9.6 | 20.4 | 0.0% | 0.1% |
2023-24 Patriot League Basketball Projected Standings
| Conference | Overall | Conference Odds | ||||
|---|---|---|---|---|---|---|
| Team | W | L | W | L | Reg | Tourn |
| Colgate | 14.8 | 3.2 | 22.1 | 8.9 | 68.9% | 60.1% |
| American | 10.3 | 7.7 | 16.8 | 14.2 | 8.7% | 10.1% |
| Navy | 9.1 | 8.9 | 14.8 | 14.2 | 4.3% | 5.6% |
| Lehigh | 8.9 | 9.1 | 13.6 | 15.4 | 4.1% | 5.3% |
| Army | 8.5 | 9.5 | 15.6 | 15.4 | 3.5% | 4.3% |
| Loyola-MD | 8.3 | 9.7 | 13.3 | 17.7 | 2.9% | 3.8% |
| Lafayette | 8.2 | 9.8 | 12.8 | 18.2 | 2.7% | 3.8% |
| Boston U | 8.2 | 9.8 | 13.6 | 17.4 | 3.0% | 3.8% |
| Bucknell | 7.0 | 11.0 | 10.6 | 20.4 | 1.2% | 1.9% |
| Holy Cross | 6.6 | 11.4 | 11.1 | 19.9 | 0.8% | 1.3% |
2023-24 SEC Basketball Projected Standings
| Conference | Overall | Conference Odds | ||||
|---|---|---|---|---|---|---|
| Team | W | L | W | L | Reg | Tourn |
| Tennessee | 12.4 | 5.6 | 21.5 | 7.5 | 25.3% | 20.8% |
| Auburn | 11.3 | 6.7 | 21.4 | 8.6 | 13.6% | 13.2% |
| Arkansas | 11.0 | 7.0 | 20.2 | 8.8 | 12.5% | 11.9% |
| Alabama | 10.8 | 7.2 | 19.6 | 10.4 | 12.7% | 12.4% |
| Kentucky | 10.1 | 7.9 | 20.3 | 10.7 | 8.2% | 8.9% |
| Texas A&M | 10.0 | 8.0 | 18.1 | 10.9 | 8.1% | 8.6% |
| Miss State | 9.5 | 8.5 | 19.2 | 10.8 | 5.9% | 6.7% |
| Mississippi | 8.9 | 9.1 | 19.5 | 11.5 | 4.1% | 4.8% |
| Florida | 8.8 | 9.2 | 17.9 | 12.1 | 3.4% | 4.0% |
| Missouri | 8.6 | 9.4 | 18.0 | 13.0 | 3.2% | 3.9% |
| LSU | 8.1 | 9.9 | 16.8 | 12.2 | 2.3% | 3.0% |
| Vanderbilt | 6.0 | 12.0 | 14.6 | 15.4 | 0.4% | 0.9% |
| Georgia | 5.4 | 12.6 | 13.5 | 16.5 | 0.3% | 0.5% |
| S Carolina | 5.3 | 12.7 | 13.9 | 16.1 | 0.1% | 0.4% |
2023-24 Southern Basketball Projected Standings
| Conference | Overall | Conference Odds | ||||
|---|---|---|---|---|---|---|
| Team | W | L | W | L | Reg | Tourn |
| Furman | 13.2 | 4.8 | 20.8 | 8.2 | 40.0% | 32.8% |
| NC-Grnsboro | 11.8 | 6.2 | 18.5 | 10.5 | 20.8% | 19.5% |
| Samford | 10.9 | 7.1 | 20.2 | 10.8 | 13.8% | 14.4% |
| W Carolina | 10.1 | 7.9 | 18.3 | 12.7 | 8.8% | 10.2% |
| Chattanooga | 9.5 | 8.5 | 17.4 | 13.6 | 6.6% | 7.9% |
| E Tenn St | 8.6 | 9.4 | 15.3 | 15.7 | 3.9% | 5.3% |
| Wofford | 8.2 | 9.8 | 14.5 | 16.5 | 3.1% | 4.4% |
| Mercer | 8.1 | 9.9 | 14.9 | 15.1 | 2.7% | 4.2% |
| Citadel | 5.0 | 13.0 | 11.1 | 19.9 | 0.2% | 0.7% |
| VMI | 4.5 | 13.5 | 9.7 | 20.3 | 0.1% | 0.5% |
2023-24 Southland Basketball Projected Standings
| Conference | Overall | Conference Odds | ||||
|---|---|---|---|---|---|---|
| Team | W | L | W | L | Reg | Tourn |
| SE Louisiana | 11.0 | 7.0 | 16.2 | 13.8 | 19.9% | 16.4% |
| McNeese St | 10.8 | 7.2 | 17.2 | 13.8 | 19.1% | 27.3% |
| Nicholls | 10.5 | 7.5 | 15.3 | 15.7 | 16.3% | 13.9% |
| TX A&M-Com | 10.0 | 8.0 | 15.5 | 15.5 | 12.0% | 11.1% |
| TX A&M-CC | 9.8 | 8.2 | 16.4 | 14.6 | 11.8% | 10.4% |
| New Orleans | 8.9 | 9.1 | 14.2 | 16.8 | 7.1% | 6.9% |
| NW State | 8.5 | 9.5 | 12.7 | 18.3 | 6.0% | 6.0% |
| Incar Word | 8.0 | 10.0 | 13.0 | 18.0 | 4.3% | 4.3% |
| Lamar | 7.4 | 10.6 | 12.1 | 18.9 | 2.9% | 3.0% |
| Hsn Christian | 5.1 | 12.9 | 7.6 | 21.4 | 0.6% | 0.7% |
2023-24 Summit Basketball Projected Standings
| Conference | Overall | Conference Odds | ||||
|---|---|---|---|---|---|---|
| Team | W | L | W | L | Reg | Tourn |
| S Dakota St | 11.2 | 4.8 | 18.9 | 10.1 | 34.6% | 29.3% |
| Oral Roberts | 10.5 | 5.5 | 17.4 | 11.6 | 27.7% | 23.8% |
| N Dakota St | 9.6 | 6.4 | 17.6 | 13.4 | 16.7% | 16.9% |
| St. Thomas | 8.1 | 7.9 | 17.1 | 13.9 | 7.8% | 9.0% |
| North Dakota | 7.6 | 8.4 | 15.3 | 15.7 | 5.0% | 7.0% |
| Kansas City | 6.7 | 9.3 | 12.6 | 16.4 | 2.6% | 4.4% |
| South Dakota | 6.3 | 9.7 | 13.1 | 16.9 | 2.0% | 3.6% |
| Neb Omaha | 6.3 | 9.7 | 14.0 | 17.0 | 2.2% | 3.6% |
| Denver | 5.7 | 10.3 | 13.3 | 17.7 | 1.4% | 2.5% |
2023-24 Sun Belt Basketball Projected Standings
| Conference | Overall | Conference Odds | ||||
|---|---|---|---|---|---|---|
| Team | W | L | W | L | Reg | Tourn |
| James Mad | 12.0 | 6.0 | 19.7 | 9.3 | 25.2% | 20.1% |
| Marshall | 11.6 | 6.4 | 18.1 | 10.9 | 18.9% | 16.3% |
| Arkansas St | 10.3 | 7.7 | 15.4 | 13.6 | 8.8% | 8.8% |
| S Mississippi | 10.3 | 7.7 | 17.0 | 12.0 | 8.8% | 9.1% |
| App State | 10.1 | 7.9 | 17.4 | 12.6 | 8.4% | 9.0% |
| S Alabama | 9.6 | 8.4 | 17.7 | 12.3 | 6.5% | 7.6% |
| Texas St | 9.6 | 8.4 | 15.7 | 14.3 | 5.8% | 6.7% |
| Louisiana | 9.3 | 8.7 | 14.8 | 13.2 | 4.8% | 6.1% |
| Old Dominion | 9.2 | 8.8 | 14.1 | 13.9 | 5.9% | 6.0% |
| Georgia St | 8.5 | 9.5 | 14.9 | 14.1 | 3.2% | 4.7% |
| Troy | 7.7 | 10.3 | 13.8 | 16.2 | 1.7% | 2.4% |
| GA Southern | 7.2 | 10.8 | 11.6 | 18.4 | 1.5% | 2.1% |
| Coastal Car | 5.5 | 12.5 | 10.6 | 16.4 | 0.4% | 0.7% |
| UL Monroe | 5.0 | 13.0 | 9.4 | 18.6 | 0.2% | 0.5% |
2023-24 SWAC Basketball Projected Standings
| Conference | Overall | Conference Odds | ||||
|---|---|---|---|---|---|---|
| Team | W | L | W | L | Reg | Tourn |
| TX Southern | 12.0 | 6.0 | 15.4 | 13.6 | 24.1% | 21.8% |
| Grambling St | 11.9 | 6.1 | 17.1 | 13.9 | 20.4% | 18.2% |
| Jackson St | 11.7 | 6.3 | 14.7 | 16.3 | 20.9% | 18.3% |
| Alcorn St | 10.0 | 8.0 | 12.1 | 18.9 | 8.8% | 9.3% |
| Southern | 9.8 | 8.2 | 14.3 | 16.7 | 7.7% | 8.7% |
| Prairie View | 8.8 | 9.2 | 12.3 | 18.7 | 4.6% | 6.2% |
| Ark Pine Bl | 8.7 | 9.3 | 14.1 | 16.9 | 4.0% | 5.3% |
| Alab A&M | 8.7 | 9.3 | 10.8 | 20.2 | 4.1% | 4.5% |
| Florida A&M | 8.0 | 10.0 | 9.6 | 18.4 | 3.0% | 3.8% |
| Beth-Cook | 6.8 | 11.2 | 12.7 | 19.3 | 1.5% | 2.0% |
| Alabama St | 6.5 | 11.5 | 10.3 | 20.7 | 0.7% | 1.3% |
| Miss Val St | 5.2 | 12.8 | 5.6 | 25.4 | 0.2% | 0.6% |
2023-24 WAC Basketball Projected Standings
| Conference | Overall | Conference Odds | ||||
|---|---|---|---|---|---|---|
| Team | W | L | W | L | Reg | Tourn |
| Ste F Austin | 13.4 | 6.6 | 20.1 | 8.9 | 26.4% | 23.6% |
| Grd Canyon | 13.3 | 6.7 | 18.8 | 10.2 | 25.0% | 22.9% |
| Seattle | 12.3 | 7.7 | 19.6 | 11.4 | 17.9% | 16.8% |
| Utah Valley | 10.6 | 9.4 | 15.4 | 14.6 | 8.3% | 8.7% |
| Cal Baptist | 10.2 | 9.8 | 17.4 | 13.6 | 6.3% | 7.2% |
| Abl Christian | 10.2 | 9.8 | 14.5 | 14.5 | 5.8% | 7.1% |
| TX-Arlington | 9.7 | 10.3 | 14.6 | 16.4 | 4.9% | 5.8% |
| Tarleton St | 8.2 | 11.8 | 13.1 | 16.9 | 1.9% | 2.7% |
| S Utah | 7.8 | 12.2 | 12.8 | 18.2 | 1.4% | 2.1% |
| Utah Tech | 7.3 | 12.7 | 12.2 | 18.8 | 1.1% | 1.7% |
| TX-Pan Am | 7.0 | 13.0 | 12.3 | 17.7 | 1.0% | 1.3% |
2023-24 WCC Basketball Projected Standings
| Conference | Overall | Conference Odds | ||||
|---|---|---|---|---|---|---|
| Team | W | L | W | L | Reg | Tourn |
| Gonzaga | 13.4 | 2.6 | 22.3 | 5.7 | 55.1% | 49.5% |
| St Marys | 12.7 | 3.3 | 24.0 | 6.0 | 36.6% | 35.6% |
| San Francisco | 9.0 | 7.0 | 18.5 | 11.5 | 3.8% | 5.7% |
| Loyola Mymt | 8.6 | 7.4 | 16.7 | 11.3 | 2.4% | 4.5% |
| Santa Clara | 7.5 | 8.5 | 15.3 | 14.7 | 1.2% | 2.4% |
| Pepperdine | 6.0 | 10.0 | 14.7 | 16.3 | 0.4% | 0.9% |
| Portland | 5.9 | 10.1 | 13.4 | 15.6 | 0.3% | 0.8% |
| Pacific | 5.8 | 10.2 | 15.3 | 15.7 | 0.2% | 0.7% |
| San Diego | 3.1 | 12.9 | 9.7 | 20.3 | 0.0% | 0.0% |
Get Our Latest College Basketball Projections
Again, once the season begins and actual game results are coming in, our most recent season projections are updated daily on the college basketball projected standings page on TeamRankings, and in a sortable table on the college basketball predictions page on BetIQ.