Preseason Bracketology: Our First 2024 NCAA Tournament Bracket Prediction
Here are our predictions for which teams will make the 2024 NCAA tournament as we get ready for the start of the 2023-24 college basketball season.
November 6, 2023 - by Jason Lisk
Last week, we released our preseason rankings and ratings, along with our preseason predictions for each conference. Here, we’ll provide our bracketology predictions for how the 2024 NCAA tournament will shape up, as of the preseason.
(In truth, the college basketball season tipped off this morning, Monday, November 6th. However, in this article we’re not taking into account the result of any of today’s games, so we can count this as a “preseason” projection.)
How Did We Do With Last Year’s Preseason Bracketology?
Let’s first recap how last year’s preseason bracketology predictions did compared to the actual 2023 NCAA tournament field.
- Forty NCAA Tournament teams correct. Last year, we ended up with 40 tournament teams that were projected in our initial preseason bracket making the field. If you added up our tournament estimates on individual teams, we would have expected to get 40.3 teams correct. The year before had more uncertainty, and that was reflected in getting three fewer tournament teams correct, even though we hit an overall number in line with our preseason odds, just like the year before.
- No top seeds correct. Our projected No. 1 seeds last year were Gonzaga, Kentucky, North Carolina, and Tennessee. Kansas and Houston were just below on the No. 2 line, and did get No. 1 seeds. The other two No. 1 seeds last year, Alabama and Purdue, were in our field but further down the seed list. Meanwhile, North Carolina, who were the preseason No. 1 team in the polls, didn’t even make the tournament. Kentucky underperformed, Tennessee dealt with injuries, and Gonzaga had a pretty solid year, but failed to get a No. 1 seed for the first time in five years.
- Twenty-one conferences correctly projected as one-bid. No conference produced an at-large that we projected as a one-bid conference last season. One conference we did not have as a one-bid league, Conference USA, ended up only getting one, but perhaps they should have gotten more respect, as Florida Atlantic advanced to the Final Four, and UAB and North Texas met in the NIT Final.
- All six power conferences projected within one of the actual number of teams in NCAA Tournament. Even though the identity of some teams changed from our projection, the overall projection on number of bids from the power conferences was pretty spot on. Our projected preseason field matched the number of tournament teams for the Big 12, Big East, Pac-12, and SEC. We had one fewer Big Ten team and one more ACC team in our preseason projection, compared to the actual field. So we also had the exact total number of power conference schools in the tournament.
- 10 of 23 one-bid conference champs correct. Based on our preseason conference tournament win odds, we expected to get an average of 7.3 correct from those 23 conferences. So hitting 10 of them is tough to do before any games have been played. If you take out the teams that ended up as No. 16 seeds, we ended up getting over half of the eventual one-bid league auto bid teams correct who were seeded as a No. 15 or better.
- Marquette, Kansas State, and Florida Atlantic were our biggest misses: Marquette and Kansas State were not projected in our preseason field, the only teams that finished on the top 3 seed lines who were not. Marquette was a young team with a lot of turnover, and point guard Tyler Kolek was not a household name at the start of last year. For Kansas State, new head coach Jerome Tang turned things around quickly with some key veteran transfers. Meanwhile, we had North Texas and UAB as the class of Conference USA, but Florida Atlantic had their first ever tournament appearance, ending in the Final Four.
We weren’t perfect, but we didn’t expect to be. Again, we made these NCAA tournament predictions before the first game of the 2022-23 season.
In the end, we were slightly ahead of our own expectations on auto bids projected, just about in line with our expectations for the top five seeds, and slightly lower on the bottom half of the at-large field. Overall, you would have expected 40.3 teams from our projected 68-team field to make it, based on our listed odds. The actual number was 40. Not too bad.
Overall, we think we did pretty well for November!
Now, on to our 2024 NCAA tournament projected bracket.
Preseason Projected No. 1 NCAA Seeds in 2022-23
Here are our projected No. 1 seeds in the 2024 NCAA tournament:
- Purdue (35% chance)
- Kansas (30% chance)
- Tennessee (23% chance)
- Duke (21% chance)
It’s worth noting that for each individual team here, we project well under a 50% chance of them earning a one seed. Sum up the odds, and you get only 109%, meaning we expect to be correct on only one of these. As with last year, there’s a lot of uncertainty at the top of the college basketball landscape.
Now, on to the rest of the bracket…
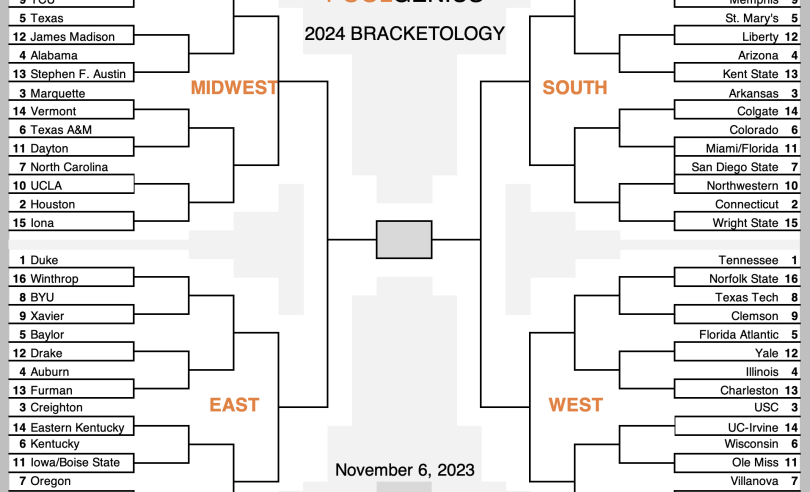
2023-24 Projected NCAA Tournament Bracket (Preseason Edition)
Here is a bracket putting each of the teams into a specific matchup. If you just want to see the projected seeds, you can go down to the table at the bottom of this post. The bracket generally follows the seed list you will see below, though we did move a couple of teams a seed line because of bracketing rules and conference restrictions on matchups.

For details on how this bracket was created, see our original Madness Strikes November blog post. That post goes into more detail, but the basic idea is:
- Simulate the regular season
- Seed and play out the conference tournaments
- Simulate the NCAA tournament selection and seeding process
2023-24 NCAA Bid Odds for All 363 Teams
Our NCAA selection and seeding model doesn’t directly produce the projected bracket you see above. Its output is a set of odds describing each team’s chance to make the NCAA tournament and to earn each specific seed (among other info).
The bracket is created at the end based on those odds. However, we also use a bit of manual intervention to assign teams to specific bracket lines.
What does that mean for you? It means you get to see lots of juicy data, if you so desire.
Below, you’ll find our official 2024 NCAA Tournament preseason projected bracketology odds for every team. Other pages on our site will be updating various odds on a daily basis as each day’s game results come in:
- For a sortable table of similar odds that we update daily, check out our NCAA Bracketology detail page.
- To go a step further and see projected round-by-round NCAA tournament advancement odds based on our simulated brackets, check out our NCAA Tournament Bracket Predictions.
Some Final Tips for Understanding Our Bracketology Odds
Creating a single projected bracket where every team is either in or out is a bit different than creating projected bid odds, which allow for more nuance.
For example, in one-bid conferences we list the team we project as most likely to win the conference tournament in our bracket. However, in many cases that team is still far more likely to miss the tournament than to make it. And a handful of teams in the conference may have a reasonable, but well below 50%, chance to reach the tournament.
A more interesting case is what happens around the at-large bubble. This preseason, the at-large cutline is around 47%. Teams that are projected with higher than a 47% chance to make the tournament are in our single bracket, while teams with lower odds are not (unless they are a projected conference champion).
This can create clusters of teams in certain conferences, or in certain groups of conferences, that are just above or just below the cutline. As a result, just counting up the number of teams in the bracket for those conferences or groups may make their outlook look better or worse than it really is.
For comparison, here is the number of teams appearing in the at-large bid range in our bracket projections (36 at-larges plus 10 auto bids) versus the number of teams we expect from each conference when we add up each individual team’s chances of making the tournament:
| Conference | Preseason Field | Expected |
|---|---|---|
| SEC | 9 | 7.5 |
| Big 12 | 8 | 7.2 |
| Big Ten | 7 | 7.0 |
| Pac-12 | 5 | 5.3 |
| ACC | 5 | 5.2 |
| Big East | 5 | 4.9 |
| Mountain West | 2 | 2.8 |
| American | 2 | 2.3 |
| Atlantic 10 | 1 | 2.0 |
| West Coast | 2 | 1.7 |
| TOTAL | 46 | 45.9 |
Take a look at the Atlantic 10, where we have only one team in our projected field. However, we expect an average of of 2.0 NCAA tourney teams from the conference, compared to 1.7 from the West Coast Conference. But Gonzaga and Saint Mary’s are in our projected field, since they make up nearly the entirety of that 1.7 teams estimate from the West Coast Conference (but are not 100% to make it).
Meanwhile, the Atlantic 10 has several teams that could emerge and get an at-large, and overall, we would project it to happen more often than not, even if no individual second team projects highly.
Overall, we expect that the next tier of conferences outside the traditional Power 6 (the American, Atlantic-10, Mountain West, and West Coast) to collectively have 8.8 teams in the tournament. But we have only seven projected in the field. So we anticipate that some more teams from those conferences will put together the resumés needed to get in, but identifying the specific ones is a bit harder.
Without Further Ado…
Here are our 2023-24 preseason bracketology odds for every team:
| TR Bracket Seed | Team | Bid | Auto | At Large | Avg Seed If In | 1-4 Seed | 1 Seed |
|---|---|---|---|---|---|---|---|
| 1 | Purdue | 95% | 27% | 69% | 3.1 | 72% | 35% |
| 1 | Kansas | 92% | 22% | 70% | 3.4 | 66% | 30% |
| 1 | Tennessee | 91% | 21% | 71% | 3.9 | 59% | 23% |
| 1 | Duke | 91% | 34% | 58% | 3.8 | 62% | 21% |
| 2 | Michigan St | 88% | 19% | 70% | 4.2 | 54% | 17% |
| 2 | Gonzaga | 81% | 49% | 32% | 4.2 | 50% | 19% |
| 2 | Houston | 86% | 16% | 71% | 4.5 | 50% | 16% |
| 2 | Connecticut | 75% | 22% | 54% | 4.2 | 45% | 13% |
| 3 | Creighton | 82% | 20% | 62% | 5.0 | 41% | 10% |
| 3 | USC | 83% | 20% | 63% | 5.1 | 40% | 11% |
| 3 | Arkansas | 82% | 12% | 70% | 5.1 | 40% | 12% |
| 3 | Marquette | 83% | 20% | 63% | 5.1 | 40% | 10% |
| 4 | Arizona | 85% | 19% | 66% | 5.4 | 39% | 11% |
| 4 | Auburn | 78% | 13% | 65% | 5.0 | 39% | 11% |
| 4 | Alabama | 83% | 13% | 71% | 5.4 | 38% | 11% |
| 4 | Illinois | 79% | 11% | 67% | 5.4 | 35% | 9% |
| 5 | Fla Atlantic | 84% | 39% | 45% | 5.8 | 34% | 6% |
| 5 | St Marys | 71% | 36% | 36% | 5.2 | 34% | 7% |
| 5 | Texas | 69% | 11% | 58% | 5.0 | 33% | 8% |
| 5 | Baylor | 70% | 9% | 61% | 5.5 | 30% | 8% |
| 6 | Kentucky | 78% | 9% | 69% | 6.0 | 30% | 8% |
| 6 | Wisconsin | 73% | 9% | 64% | 5.7 | 30% | 7% |
| 6 | Colorado | 65% | 14% | 51% | 5.6 | 26% | 5% |
| 6 | Texas A&M | 73% | 9% | 64% | 6.1 | 26% | 6% |
| 7 | Villanova | 71% | 12% | 59% | 6.3 | 24% | 4% |
| 7 | Oregon | 64% | 13% | 51% | 5.8 | 24% | 5% |
| 7 | N Carolina | 79% | 14% | 66% | 6.9 | 22% | 4% |
| 7 | San Diego St | 73% | 26% | 47% | 6.6 | 23% | 4% |
| 8 | Maryland | 64% | 7% | 56% | 6.0 | 23% | 4% |
| 8 | Texas Tech | 63% | 7% | 56% | 6.0 | 23% | 5% |
| 8 | TX Christian | 52% | 8% | 44% | 5.2 | 23% | 5% |
| 8 | Miss State | 61% | 7% | 54% | 6.3 | 20% | 4% |
| 9 | Clemson | 71% | 10% | 61% | 7.5 | 16% | 2% |
| 9 | Memphis | 66% | 25% | 41% | 7.6 | 14% | 2% |
| 9 | BYU | 48% | 6% | 41% | 5.4 | 20% | 4% |
| 9 | Kansas St | 59% | 5% | 55% | 7.1 | 15% | 2% |
| 10 | Xavier | 58% | 8% | 50% | 7.2 | 14% | 2% |
| 10 | UCLA | 51% | 10% | 41% | 6.5 | 15% | 2% |
| 10 | Virginia | 51% | 10% | 42% | 7.0 | 13% | 1% |
| 10 | Northwestern | 48% | 5% | 42% | 6.3 | 15% | 2% |
| 11 | Dayton | 59% | 25% | 33% | 8.4 | 8% | 1% |
| 11 | Miami | 49% | 10% | 40% | 6.9 | 12% | 1% |
| 11 | Iowa | 49% | 5% | 44% | 6.9 | 12% | 2% |
| 11 | Mississippi | 48% | 5% | 43% | 6.6 | 13% | 2% |
| 11 | Florida | 48% | 4% | 44% | 7.3 | 10% | 2% |
| 11 | Boise St | 48% | 17% | 31% | 7.2 | 11% | 1% |
| 12 | Drake | 31% | 30% | 1% | 10.0 | 2% | 0% |
| 12 | Liberty | 27% | 27% | 0% | 11.1 | 1% | 0% |
| 12 | Yale | 42% | 42% | 0% | 11.1 | 1% | 0% |
| 12 | James Mad | 20% | 20% | 0% | 11.9 | 0% | 0% |
| 13 | Col Charlestn | 26% | 26% | 0% | 12.1 | 0% | 0% |
| 13 | Kent St | 26% | 26% | 0% | 12.2 | 0% | 0% |
| 13 | Ste F Austin | 26% | 26% | 0% | 12.4 | 0% | 0% |
| 13 | Furman | 33% | 33% | 0% | 12.4 | 0% | 0% |
| 14 | UC Irvine | 24% | 24% | 0% | 12.7 | 0% | 0% |
| 14 | Colgate | 60% | 60% | 0% | 13.3 | 0% | 0% |
| 14 | Vermont | 42% | 42% | 0% | 13.3 | 0% | 0% |
| 14 | E Kentucky | 27% | 27% | 0% | 13.6 | 0% | 0% |
| 15 | Wright St | 23% | 23% | 0% | 13.7 | 0% | 0% |
| 15 | S Dakota St | 32% | 32% | 0% | 13.9 | 0% | 0% |
| 15 | E Washingtn | 22% | 22% | 0% | 14.0 | 0% | 0% |
| 15 | Iona | 31% | 31% | 0% | 14.0 | 0% | 0% |
| 16 | Norfolk St | 30% | 30% | 0% | 15.4 | 0% | 0% |
| 16 | Winthrop | 22% | 22% | 0% | 14.2 | 0% | 0% |
| 16 | McNeese St | 30% | 30% | 0% | 15.7 | 0% | 0% |
| 16 | Wagner | 28% | 28% | 0% | 15.7 | 0% | 0% |
| 16 | TX Southern | 22% | 22% | 0% | 15.5 | 0% | 0% |
| 16 | Morehead St | 20% | 20% | 0% | 15.4 | 0% | 0% |
| Missouri | 47% | 4% | 43% | 7.3 | 10% | 2% | |
| Michigan | 46% | 3% | 43% | 7.6 | 9% | 1% | |
| Utah | 46% | 6% | 41% | 7.8 | 8% | 1% | |
| Indiana | 46% | 3% | 43% | 7.7 | 8% | 1% | |
| St Johns | 46% | 6% | 40% | 7.4 | 9% | 1% | |
| Stanford | 44% | 8% | 36% | 6.7 | 12% | 2% | |
| Rutgers | 44% | 3% | 40% | 7.2 | 9% | 1% | |
| Washington | 43% | 5% | 38% | 7.7 | 8% | 1% | |
| New Mexico | 42% | 13% | 30% | 8.0 | 6% | 1% | |
| Cincinnati | 42% | 4% | 38% | 6.8 | 11% | 2% | |
| Providence | 41% | 7% | 35% | 7.0 | 10% | 1% | |
| Ohio St | 41% | 5% | 36% | 6.3 | 13% | 2% | |
| Nevada | 41% | 13% | 28% | 7.9 | 7% | 1% | |
| VA Tech | 40% | 6% | 34% | 8.0 | 6% | 0% | |
| Iowa St | 38% | 5% | 33% | 5.9 | 13% | 2% | |
| St Bonavent | 38% | 18% | 20% | 9.0 | 3% | 0% | |
| NC State | 36% | 6% | 30% | 7.8 | 6% | 0% | |
| UNLV | 35% | 16% | 19% | 9.4 | 3% | 0% | |
| Oklahoma | 34% | 4% | 30% | 6.5 | 10% | 1% | |
| Arizona St | 33% | 3% | 30% | 8.8 | 3% | 0% | |
| W Virginia | 33% | 2% | 32% | 8.3 | 4% | 0% | |
| Florida St | 27% | 3% | 24% | 9.1 | 2% | 0% | |
| Princeton | 26% | 26% | 0% | 13.1 | 0% | 0% | |
| Oral Roberts | 26% | 26% | 0% | 14.3 | 0% | 0% | |
| LSU | 26% | 3% | 23% | 6.9 | 6% | 1% | |
| Seton Hall | 25% | 4% | 21% | 8.2 | 3% | 0% | |
| Hofstra | 25% | 25% | 0% | 12.1 | 0% | 0% | |
| Pittsburgh | 24% | 4% | 20% | 8.2 | 3% | 0% | |
| Grd Canyon | 24% | 24% | 0% | 12.2 | 0% | 0% | |
| Sacred Hrt | 24% | 24% | 0% | 15.8 | 0% | 0% | |
| Howard | 23% | 23% | 0% | 15.6 | 0% | 0% | |
| Akron | 23% | 23% | 0% | 12.3 | 0% | 0% | |
| Cleveland St | 23% | 23% | 0% | 13.7 | 0% | 0% | |
| Duquesne | 22% | 11% | 12% | 9.8 | 1% | 0% | |
| Oklahoma St | 22% | 1% | 21% | 7.9 | 3% | 0% | |
| Mass Lowell | 22% | 22% | 0% | 14.1 | 0% | 0% | |
| Weber St | 21% | 21% | 0% | 14.0 | 0% | 0% | |
| NC-Asheville | 21% | 21% | 0% | 14.1 | 0% | 0% | |
| NC-Grnsboro | 20% | 20% | 0% | 13.1 | 0% | 0% | |
| Fla Gulf Cst | 20% | 20% | 0% | 13.9 | 0% | 0% | |
| Radford | 19% | 19% | 0% | 14.2 | 0% | 0% | |
| GA Tech | 19% | 1% | 17% | 10.2 | 1% | 0% | |
| VCU | 19% | 8% | 11% | 10.2 | 1% | 0% | |
| N Dakota St | 19% | 19% | 0% | 14.5 | 0% | 0% | |
| Wichita St | 19% | 6% | 13% | 10.1 | 1% | 0% | |
| SE Louisiana | 19% | 19% | 0% | 15.7 | 0% | 0% | |
| Grambling St | 18% | 18% | 0% | 15.6 | 0% | 0% | |
| Bradley | 18% | 16% | 3% | 11.1 | 0% | 0% | |
| Nebraska | 18% | 2% | 17% | 7.4 | 3% | 0% | |
| Jackson St | 18% | 18% | 0% | 15.6 | 0% | 0% | |
| Bryant | 18% | 18% | 0% | 14.2 | 0% | 0% | |
| Ohio | 18% | 18% | 0% | 12.6 | 0% | 0% | |
| Montana | 18% | 18% | 0% | 14.2 | 0% | 0% | |
| Seattle | 17% | 17% | 0% | 12.8 | 0% | 0% | |
| Youngs St | 17% | 17% | 0% | 14.0 | 0% | 0% | |
| NC Central | 17% | 17% | 0% | 15.7 | 0% | 0% | |
| Sam Hous St | 17% | 16% | 0% | 12.1 | 0% | 0% | |
| Marshall | 17% | 16% | 0% | 11.9 | 0% | 0% | |
| Vanderbilt | 16% | 1% | 15% | 8.9 | 1% | 0% | |
| Nicholls | 16% | 16% | 0% | 15.7 | 0% | 0% | |
| UCSB | 16% | 16% | 0% | 13.2 | 0% | 0% | |
| Colorado St | 16% | 5% | 11% | 9.2 | 1% | 0% | |
| Lipscomb | 16% | 16% | 0% | 14.0 | 0% | 0% | |
| Utah St | 15% | 7% | 9% | 8.8 | 2% | 0% | |
| Lg Beach St | 15% | 15% | 0% | 13.3 | 0% | 0% | |
| SIU Edward | 15% | 15% | 0% | 15.5 | 0% | 0% | |
| Indiana St | 15% | 15% | 1% | 11.6 | 0% | 0% | |
| UAB | 15% | 5% | 10% | 10.1 | 1% | 0% | |
| Central Conn | 15% | 15% | 0% | 15.9 | 0% | 0% | |
| Syracuse | 15% | 1% | 14% | 10.4 | 0% | 0% | |
| LA Tech | 14% | 14% | 0% | 12.3 | 0% | 0% | |
| Drexel | 14% | 14% | 0% | 13.1 | 0% | 0% | |
| Toledo | 14% | 14% | 0% | 12.9 | 0% | 0% | |
| Samford | 14% | 14% | 0% | 13.7 | 0% | 0% | |
| Cornell | 14% | 14% | 0% | 13.1 | 0% | 0% | |
| Wake Forest | 14% | 2% | 12% | 9.4 | 1% | 0% | |
| Gard-Webb | 14% | 14% | 0% | 14.5 | 0% | 0% | |
| Saint Louis | 14% | 6% | 8% | 10.6 | 0% | 0% | |
| Loyola-Chi | 13% | 11% | 3% | 10.1 | 1% | 0% | |
| UCF | 13% | 1% | 13% | 9.2 | 1% | 0% | |
| N Kentucky | 13% | 13% | 0% | 14.3 | 0% | 0% | |
| Hawaii | 13% | 13% | 0% | 13.4 | 0% | 0% | |
| TN Martin | 13% | 13% | 0% | 15.5 | 0% | 0% | |
| NC-Wilmgton | 13% | 13% | 0% | 13.1 | 0% | 0% | |
| UC Davis | 12% | 12% | 0% | 13.4 | 0% | 0% | |
| Quinnipiac | 12% | 12% | 0% | 15.0 | 0% | 0% | |
| F Dickinson | 12% | 12% | 0% | 15.9 | 0% | 0% | |
| TN State | 12% | 12% | 0% | 15.5 | 0% | 0% | |
| Rider | 12% | 12% | 0% | 15.0 | 0% | 0% | |
| TX A&M-CC | 12% | 12% | 0% | 15.8 | 0% | 0% | |
| Merrimack | 12% | 12% | 0% | 15.9 | 0% | 0% | |
| AR Lit Rock | 11% | 11% | 0% | 15.5 | 0% | 0% | |
| Richmond | 11% | 6% | 5% | 10.8 | 0% | 0% | |
| CS Fullerton | 11% | 11% | 0% | 13.5 | 0% | 0% | |
| N Iowa | 11% | 10% | 1% | 12.0 | 0% | 0% | |
| WI-Milwkee | 11% | 11% | 0% | 14.3 | 0% | 0% | |
| Tulane | 11% | 5% | 5% | 9.8 | 1% | 0% | |
| American | 10% | 10% | 0% | 14.9 | 0% | 0% | |
| Penn St | 10% | 1% | 9% | 8.3 | 1% | 0% | |
| W Carolina | 10% | 10% | 0% | 13.9 | 0% | 0% | |
| W Kentucky | 10% | 10% | 0% | 12.8 | 0% | 0% | |
| Georgia | 10% | 1% | 9% | 9.2 | 1% | 0% | |
| Wash State | 10% | 2% | 8% | 8.6 | 1% | 0% | |
| S Methodist | 10% | 5% | 4% | 9.9 | 0% | 0% | |
| Utah Valley | 9% | 9% | 0% | 13.2 | 0% | 0% | |
| Arkansas St | 9% | 9% | 0% | 12.9 | 0% | 0% | |
| Missouri St | 9% | 8% | 1% | 12.3 | 0% | 0% | |
| Alcorn St | 9% | 9% | 0% | 15.8 | 0% | 0% | |
| App State | 9% | 9% | 0% | 12.8 | 0% | 0% | |
| S Mississippi | 9% | 9% | 0% | 13.0 | 0% | 0% | |
| N Mex State | 9% | 9% | 0% | 13.0 | 0% | 0% | |
| Longwood | 9% | 9% | 0% | 15.0 | 0% | 0% | |
| Southern | 9% | 9% | 0% | 15.8 | 0% | 0% | |
| Siena | 9% | 9% | 0% | 15.1 | 0% | 0% | |
| Stetson | 9% | 9% | 0% | 14.5 | 0% | 0% | |
| Middle Tenn | 9% | 9% | 0% | 12.9 | 0% | 0% | |
| Portland St | 8% | 8% | 0% | 14.8 | 0% | 0% | |
| Chattanooga | 8% | 8% | 0% | 14.1 | 0% | 0% | |
| Murray St | 8% | 8% | 0% | 12.5 | 0% | 0% | |
| San Francisco | 8% | 5% | 2% | 9.8 | 0% | 0% | |
| Morgan St | 8% | 8% | 0% | 15.9 | 0% | 0% | |
| New Orleans | 8% | 8% | 0% | 15.9 | 0% | 0% | |
| Davidson | 8% | 4% | 4% | 11.4 | 0% | 0% | |
| Austin Peay | 8% | 8% | 0% | 14.4 | 0% | 0% | |
| Cal Baptist | 8% | 8% | 0% | 13.5 | 0% | 0% | |
| North Dakota | 8% | 8% | 0% | 15.3 | 0% | 0% | |
| Towson | 8% | 8% | 0% | 13.7 | 0% | 0% | |
| S Alabama | 8% | 8% | 0% | 13.3 | 0% | 0% | |
| W Illinois | 8% | 8% | 0% | 15.7 | 0% | 0% | |
| Loyola Mymt | 8% | 5% | 3% | 9.7 | 0% | 0% | |
| Abl Christian | 7% | 7% | 0% | 13.4 | 0% | 0% | |
| Niagara | 7% | 7% | 0% | 15.3 | 0% | 0% | |
| SE Missouri | 7% | 7% | 0% | 15.7 | 0% | 0% | |
| TX El Paso | 7% | 7% | 0% | 13.2 | 0% | 0% | |
| Maryland ES | 7% | 7% | 0% | 15.9 | 0% | 0% | |
| E Illinois | 7% | 7% | 0% | 15.7 | 0% | 0% | |
| N Alabama | 7% | 7% | 0% | 14.4 | 0% | 0% | |
| High Point | 7% | 7% | 0% | 15.6 | 0% | 0% | |
| N Arizona | 7% | 7% | 0% | 14.9 | 0% | 0% | |
| St Fran (PA) | 7% | 7% | 0% | 16.0 | 0% | 0% | |
| N Colorado | 7% | 7% | 0% | 15.0 | 0% | 0% | |
| North Texas | 7% | 4% | 3% | 10.1 | 0% | 0% | |
| Montana St | 7% | 7% | 0% | 15.0 | 0% | 0% | |
| Texas St | 7% | 7% | 0% | 13.2 | 0% | 0% | |
| Canisius | 7% | 7% | 0% | 15.3 | 0% | 0% | |
| NW State | 7% | 7% | 0% | 15.9 | 0% | 0% | |
| St Josephs | 6% | 3% | 4% | 11.5 | 0% | 0% | |
| TN Tech | 6% | 6% | 0% | 15.7 | 0% | 0% | |
| Delaware | 6% | 6% | 0% | 13.9 | 0% | 0% | |
| Belmont | 6% | 6% | 0% | 12.5 | 0% | 0% | |
| Prairie View | 6% | 6% | 0% | 15.8 | 0% | 0% | |
| Sac State | 6% | 6% | 0% | 15.0 | 0% | 0% | |
| Kennesaw St | 6% | 6% | 0% | 14.5 | 0% | 0% | |
| Louisiana | 6% | 6% | 0% | 13.2 | 0% | 0% | |
| Brown | 6% | 6% | 0% | 13.8 | 0% | 0% | |
| Maryland BC | 6% | 6% | 0% | 14.9 | 0% | 0% | |
| Mt St Marys | 6% | 6% | 0% | 15.4 | 0% | 0% | |
| UC Riverside | 6% | 6% | 0% | 14.0 | 0% | 0% | |
| Old Dominion | 6% | 6% | 0% | 13.3 | 0% | 0% | |
| TX-Arlington | 6% | 6% | 0% | 13.7 | 0% | 0% | |
| Navy | 6% | 6% | 0% | 15.3 | 0% | 0% | |
| Bowling Grn | 5% | 5% | 0% | 14.1 | 0% | 0% | |
| Florida Intl | 5% | 5% | 0% | 13.5 | 0% | 0% | |
| E Tenn St | 5% | 5% | 0% | 14.4 | 0% | 0% | |
| Ark Pine Bl | 5% | 5% | 0% | 15.9 | 0% | 0% | |
| Fresno St | 5% | 2% | 3% | 10.4 | 0% | 0% | |
| Delaware St | 5% | 5% | 0% | 15.9 | 0% | 0% | |
| U Penn | 5% | 5% | 0% | 14.1 | 0% | 0% | |
| S Carolina | 5% | 0% | 5% | 8.9 | 0% | 0% | |
| Lehigh | 5% | 5% | 0% | 15.3 | 0% | 0% | |
| Marist | 5% | 5% | 0% | 15.4 | 0% | 0% | |
| Incar Word | 5% | 5% | 0% | 15.9 | 0% | 0% | |
| St Peters | 5% | 5% | 0% | 15.4 | 0% | 0% | |
| Fairfield | 5% | 5% | 0% | 15.5 | 0% | 0% | |
| SC Upstate | 5% | 5% | 0% | 15.2 | 0% | 0% | |
| Georgia St | 5% | 5% | 0% | 13.4 | 0% | 0% | |
| Kansas City | 5% | 5% | 0% | 15.4 | 0% | 0% | |
| Alab A&M | 5% | 5% | 0% | 15.9 | 0% | 0% | |
| Coppin St | 5% | 5% | 0% | 15.9 | 0% | 0% | |
| Jacksonville | 5% | 5% | 0% | 14.8 | 0% | 0% | |
| S Illinois | 5% | 5% | 0% | 13.1 | 0% | 0% | |
| Wofford | 5% | 5% | 0% | 14.5 | 0% | 0% | |
| S Car State | 4% | 4% | 0% | 16.0 | 0% | 0% | |
| Mercer | 4% | 4% | 0% | 14.6 | 0% | 0% | |
| Butler | 4% | 0% | 4% | 10.1 | 0% | 0% | |
| Army | 4% | 4% | 0% | 15.4 | 0% | 0% | |
| Neb Omaha | 4% | 4% | 0% | 15.5 | 0% | 0% | |
| Maine | 4% | 4% | 0% | 15.1 | 0% | 0% | |
| Geo Mason | 4% | 3% | 1% | 11.5 | 0% | 0% | |
| Ball St | 4% | 4% | 0% | 14.4 | 0% | 0% | |
| South Dakota | 4% | 4% | 0% | 15.5 | 0% | 0% | |
| Harvard | 4% | 4% | 0% | 14.2 | 0% | 0% | |
| Florida A&M | 4% | 4% | 0% | 15.9 | 0% | 0% | |
| Lafayette | 4% | 4% | 0% | 15.4 | 0% | 0% | |
| Loyola-MD | 4% | 4% | 0% | 15.4 | 0% | 0% | |
| Boston U | 4% | 4% | 0% | 15.3 | 0% | 0% | |
| Santa Clara | 4% | 2% | 1% | 10.8 | 0% | 0% | |
| Temple | 3% | 2% | 1% | 11.2 | 0% | 0% | |
| Oakland | 3% | 3% | 0% | 14.9 | 0% | 0% | |
| Lamar | 3% | 3% | 0% | 15.9 | 0% | 0% | |
| S Florida | 3% | 3% | 1% | 11.3 | 0% | 0% | |
| Charlotte | 3% | 2% | 2% | 11.4 | 0% | 0% | |
| N Florida | 3% | 3% | 0% | 14.9 | 0% | 0% | |
| Buffalo | 3% | 3% | 0% | 14.3 | 0% | 0% | |
| Idaho St | 3% | 3% | 0% | 15.4 | 0% | 0% | |
| Northeastrn | 3% | 3% | 0% | 14.4 | 0% | 0% | |
| Louisville | 3% | 0% | 3% | 11.0 | 0% | 0% | |
| Rob Morris | 3% | 3% | 0% | 14.9 | 0% | 0% | |
| Detroit | 3% | 3% | 0% | 15.1 | 0% | 0% | |
| Denver | 3% | 3% | 0% | 15.7 | 0% | 0% | |
| N Hampshire | 3% | 3% | 0% | 15.3 | 0% | 0% | |
| IPFW | 3% | 3% | 0% | 15.0 | 0% | 0% | |
| U Mass | 3% | 2% | 1% | 12.1 | 0% | 0% | |
| Miami (OH) | 3% | 3% | 0% | 14.5 | 0% | 0% | |
| LIU | 3% | 3% | 0% | 16.0 | 0% | 0% | |
| E Carolina | 3% | 2% | 0% | 11.4 | 0% | 0% | |
| Fordham | 3% | 2% | 1% | 12.1 | 0% | 0% | |
| Troy | 3% | 3% | 0% | 13.9 | 0% | 0% | |
| Binghamton | 2% | 2% | 0% | 15.2 | 0% | 0% | |
| N Illinois | 2% | 2% | 0% | 14.5 | 0% | 0% | |
| DePaul | 2% | 0% | 2% | 10.5 | 0% | 0% | |
| Illinois St | 2% | 2% | 0% | 13.6 | 0% | 0% | |
| S Utah | 2% | 2% | 0% | 14.0 | 0% | 0% | |
| Dartmouth | 2% | 2% | 0% | 14.5 | 0% | 0% | |
| CS Bakersfld | 2% | 2% | 0% | 14.5 | 0% | 0% | |
| GA Southern | 2% | 2% | 0% | 14.0 | 0% | 0% | |
| Rice | 2% | 2% | 0% | 11.6 | 0% | 0% | |
| Stony Brook | 2% | 2% | 0% | 14.7 | 0% | 0% | |
| Manhattan | 2% | 2% | 0% | 15.7 | 0% | 0% | |
| Beth-Cook | 2% | 2% | 0% | 16.0 | 0% | 0% | |
| Jksnville St | 2% | 2% | 0% | 14.4 | 0% | 0% | |
| Bucknell | 2% | 2% | 0% | 15.6 | 0% | 0% | |
| Boston Col | 2% | 0% | 2% | 10.6 | 0% | 0% | |
| Georgetown | 2% | 0% | 1% | 9.7 | 0% | 0% | |
| Presbyterian | 2% | 2% | 0% | 15.7 | 0% | 0% | |
| Minnesota | 2% | 0% | 1% | 8.7 | 0% | 0% | |
| Charl South | 2% | 2% | 0% | 15.7 | 0% | 0% | |
| California | 2% | 0% | 1% | 10.8 | 0% | 0% | |
| Rhode Island | 1% | 1% | 0% | 12.4 | 0% | 0% | |
| Holy Cross | 1% | 1% | 0% | 15.7 | 0% | 0% | |
| TX-Pan Am | 1% | 1% | 0% | 14.2 | 0% | 0% | |
| Alabama St | 1% | 1% | 0% | 16.0 | 0% | 0% | |
| Albany | 1% | 1% | 0% | 15.4 | 0% | 0% | |
| Air Force | 1% | 1% | 0% | 11.6 | 0% | 0% | |
| Campbell | 1% | 1% | 0% | 14.9 | 0% | 0% | |
| San Jose St | 1% | 1% | 1% | 11.8 | 0% | 0% | |
| Notre Dame | 1% | 0% | 1% | 11.3 | 0% | 0% | |
| NJIT | 1% | 1% | 0% | 15.4 | 0% | 0% | |
| Pepperdine | 1% | 1% | 0% | 12.5 | 0% | 0% | |
| Portland | 1% | 1% | 0% | 11.6 | 0% | 0% | |
| Columbia | 1% | 1% | 0% | 14.9 | 0% | 0% | |
| La Salle | 1% | 1% | 0% | 13.1 | 0% | 0% | |
| Hsn Christian | 1% | 1% | 0% | 16.0 | 0% | 0% | |
| E Michigan | 1% | 1% | 0% | 15.3 | 0% | 0% | |
| IL-Chicago | 1% | 1% | 0% | 14.3 | 0% | 0% | |
| Oregon St | 1% | 0% | 1% | 10.0 | 0% | 0% | |
| Pacific | 1% | 1% | 0% | 12.6 | 0% | 0% | |
| Citadel | 1% | 1% | 0% | 15.6 | 0% | 0% | |
| Idaho | 1% | 1% | 0% | 15.8 | 0% | 0% | |
| Coastal Car | 1% | 1% | 0% | 14.6 | 0% | 0% | |
| Miss Val St | 1% | 1% | 0% | 16.0 | 0% | 0% | |
| WI-Grn Bay | 1% | 1% | 0% | 15.5 | 0% | 0% | |
| Elon | 1% | 1% | 0% | 15.3 | 0% | 0% | |
| IUPUI | 1% | 1% | 0% | 15.7 | 0% | 0% | |
| Wyoming | 1% | 0% | 0% | 12.0 | 0% | 0% | |
| Wm & Mary | 1% | 1% | 0% | 15.1 | 0% | 0% | |
| UL Monroe | 0% | 0% | 0% | 14.6 | 0% | 0% | |
| W Michigan | 0% | 0% | 0% | 15.4 | 0% | 0% | |
| VMI | 0% | 0% | 0% | 15.5 | 0% | 0% | |
| Central Ark | 0% | 0% | 0% | 15.3 | 0% | 0% | |
| Cal St Nrdge | 0% | 0% | 0% | 15.1 | 0% | 0% | |
| Central Mich | 0% | 0% | 0% | 15.5 | 0% | 0% | |
| Hampton | 0% | 0% | 0% | 15.3 | 0% | 0% | |
| Geo Wshgtn | 0% | 0% | 0% | 13.6 | 0% | 0% | |
| Tulsa | 0% | 0% | 0% | 13.0 | 0% | 0% | |
| Valparaiso | 0% | 0% | 0% | 14.9 | 0% | 0% | |
| Monmouth | 0% | 0% | 0% | 15.4 | 0% | 0% | |
| Cal Poly | 0% | 0% | 0% | 15.3 | 0% | 0% | |
| UTSA | 0% | 0% | 0% | 13.8 | 0% | 0% | |
| NC A&T | 0% | 0% | 0% | 15.8 | 0% | 0% | |
| Evansville | 0% | 0% | 0% | 15.2 | 0% | 0% | |
| San Diego | 0% | 0% | 0% | 14.1 | 0% | 0% | |
| Chicago St | 0% | 0% | 0% | 0.0 | 0% | 0% | |
| S Indiana | 0% | 0% | 0% | 0.0 | 0% | 0% | |
| St. Thomas | 0% | 0% | 0% | 0.0 | 0% | 0% | |
| Lindenwood | 0% | 0% | 0% | 0.0 | 0% | 0% | |
| Queens | 0% | 0% | 0% | 0.0 | 0% | 0% | |
| Utah Tech | 0% | 0% | 0% | 0.0 | 0% | 0% | |
| Le Moyne | 0% | 0% | 0% | 0.0 | 0% | 0% | |
| Stonehill | 0% | 0% | 0% | 0.0 | 0% | 0% | |
| Tarleton St | 0% | 0% | 0% | 0.0 | 0% | 0% | |
| TX A&M-Com | 0% | 0% | 0% | 0.0 | 0% | 0% | |
| Bellarmine | 0% | 0% | 0% | 0.0 | 0% | 0% | |
| UCSD | 0% | 0% | 0% | 0.0 | 0% | 0% |