Super Bowl Point Spread Trends: Insights For Super Bowl 59

Do more favorites or underdogs cover the Super Bowl point spread? Does good defense or offense win more against the spread? Here's the data.

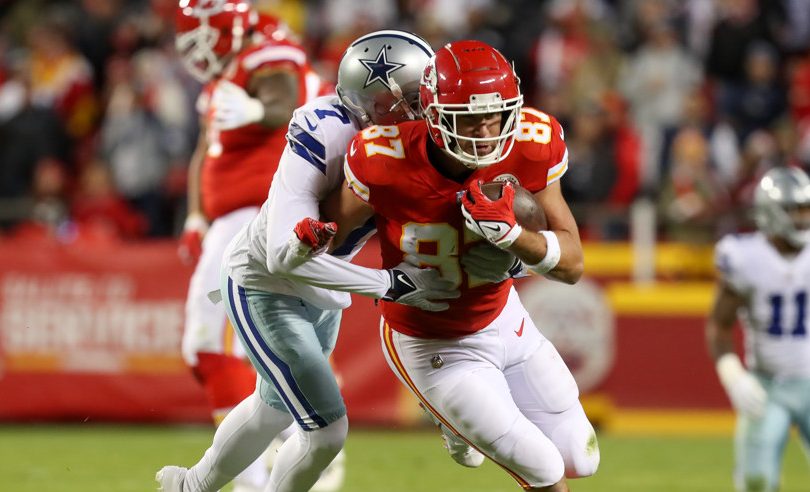
Kansas City Chiefs tight end Travis Kelce (87) is tackled by Dallas Cowboys cornerback Trevon Diggs (7) in the third quarter of an NFL football game between the Dallas Cowboys and Kansas City Chiefs on Nov 21, 2021 at GEHA Field at Arrowhead Stadium in Kansas City, MO.

Travis Kelce is part of an efficient Chiefs offense (Scott Winters/Icon Sportswire)

In this post, we’ll look at some historical Super Bowl point spread trends ahead of the Kansas City Chiefs vs. Philadelphia Eagles on February 9, 2025.

While trend-based analysis requires caution (and a grain of salt), these insights can help shape your opinion regarding the point spread and line movement ahead of Super Bowl 59.

Super Bowl Point Spread Trends

The trends we will investigate include:

  • How have Super Bowl favorites and underdogs performed against the spread?
  • The ATS (against the spread) performance of Super Bowl teams based on win/loss record, playoff seeding, and other regular-season traits.
  • How did teams perform straight up and ATS when they had passing efficiency advantages on offense and defense?
  • Super Bowl point spread records based on stats like how teams ranked in third-down and fourth-down conversion rates, field-goal percentage (for and against), punting, and touchbacks.

Super Bowl Point Spread Trends: Favorites vs. Underdogs

Here’s a look at how the favorites and underdogs have performed both straight up and against the spread since the 1995 season in the Super Bowl, with some observations below:

CategorySU WSU LSU PCTATS WATS LATS TATS PCT
Favorites161355.2%918234.5%
Underdogs131644.8%189265.5%
AFC Favorites11761.1%810044.4%
NFC Favorites5645.5%18218.2%
Favored by 3 or less6554.5%65054.5%
Favored by 3.5 to 62528.6%16014.3%
Favored by 6.5 or more8372.7%27227.3%
  • Super Bowl underdogs have covered more frequently than favorites.
  • The only NFC favorite to cover in the last 28 years was Green Bay in the 2010-11 season (as a 3-point favorite against Pittsburgh).
  • Improbably, small favorites of a field goal or less have won outright at a similar rate to larger favorites and covered far more often, as the Super Bowl has seen plenty of big upsets in the last 29 years.
  • Teams favored by more than a field goal have only been 3-13-2 ATS in the Super Bowl since 1995.

2025 Analysis: Kansas City has opened as a favorite, of around 1.5 points, against Philadelphia. The line is currently under a field goal, and teams favored by a field goal or less have gone 6-5 SU and ATS since 1995.

Super Bowl Point Spread Trends: Team Record

Here is how Super Bowl teams performed based on relative win/loss record and where they were seeded in their conference at the start of the playoffs:

CategorySU WSU LSU PCTATS WATS LATS TATS PCT
Better Record81436.4%219111.4%
Worse Record14863.6%192188.6%
1 Seeds121741.4%918234.5%
2 Seeds6842.9%58139.3%
3 Seeds2166.7%300100.0%
4 Seeds5362.5%61181.3%
5 Seeds20100.0%200100.0%
6 Seeds20100.0%200100.0%
Team played in WC Round11473.3%131190.0%
Team had bye182541.9%1426336.0%
Worse Seed as Favorite60100.0%51083.3%
Same Seed as Favorite3537.5%26025.0%
Better Seed as Favorite7846.7%211220.0%
  • The team with the worse record entering the Super Bowl is a startling 19-2-1 against the spread over the last 29 years. This makes sense in the context of the great performance of bigger underdogs we saw in the section above.
  • Teams that advanced to the Super Bowl after playing in the Wild Card Round are 13-1-1 ATS over that span.
  • When the team that entered the playoffs with the worse seed is made the favorite in the Super Bowl, they are 6-0 SU and 5-1 ATS. All other favorites are 10-13 SU and 4-17-2 ATS.

2025 Analysis: Kansas City (15-2 in the regular season) was the No. 1 seed in the AFC and got a first-round bye. Philadelphia (14-3) ended up with the No. 2 seed in the NFC. Teams that have advanced to the Super Bowl after playing in the Wild Card Round have been extremely successful in recent history. However, Philadelphia is the first No. 2 seed to advance out of the Wild Card Round since the format was changed in 2020, eliminating byes for the No. 2 seed. (When these two teams met two years ago, both were No. 1 seeds).

Super Bowl Point Spread Trends: Passing & Rushing Stats

Here is how teams that performed better in various rushing or passing categories entering the Super Bowl performed, going back to 1995. But first, a couple of  explanations:

  • NYPA means net yards per pass attempt and reflects yards per play after accounting for sacks on any passing play.
  • YPC means yards per carry.
  • Some categories may not add to 29 games because of ties in that category because we rounded the values before comparing. So, for example, 4.31 and 4.29 YPC would both round to 4.3 and be considered a tie.
CategorySU WSU LSU PCTATS WATS LATS TATS PCT2025 LEADER
Better NYPA Offense111837.9%819231.0%PHI
Better NYPA Allowed Defense171258.6%1413251.7%PHI
Better YPC Offense131644.8%1215244.8%PHI
Better YPC Allowed Defense141156.0%1113146.0%KC
Better NYPA Difference151451.7%1017237.9%PHI
Better YPC Difference151353.6%1115242.9%PHI
Better Turnover Differential141156.0%1112248.0%PHI
Better Sack Rate on Offense161355.2%1512255.2%KC
Better Defensive Sack Rate141450.0%1412253.6%PHI
Better Completion % on Offense121741.4%1116241.4%PHI
Better Completion % Allowed Defense19773.1%1311253.8%PHI
  • The best teams have tended to have some of the best passing attacks in recent years. So, with all the upsets, the team with the offensive passing advantage has performed poorly against the spread in the Super Bowl over the last 28 years.
  • With that said, the spread performance of the team with the advantage in offensive NYPA is worse than the spread performance by favorites overall.

2025 Analysis: Kansas City’s passing attack suffered in the regular season, a function of injuries at both receiver and on the offensive line. Philadelphia is the lower-volume passing team, but actually had the higher net yards per pass attempt. Philadelphia also had the more explosive rushing game, and led in most categories. The Eagles’ pass defense also led the NFL.

The only two categories where Kansas City had better regular season numbers were in defensive rushing yards per carry allowed (4.1 to 4.3) and offensive sack rate, as Philadelphia was tied for 30th as Hurts (and his backups) took a sack on about 9% of all drop backs. The two teams were virtually in completion percentage on offense.

Other Team Stat Comparisons

Here’s another table showing some stats on our NFL team stats pages going back to 2003 (so these include the last 21 Super Bowls).

It can be dangerous to draw any firm conclusions from such small sample sizes, but we’ll provide the numbers if you want to compare how teams with certain statistical edges have done.

Note that the records in the table below are from the perspective of the Super Bowl team that ranked better in that specific stat category.

CategorySU WSU LSU PCTATS WATS LATS PCT2025 LEADER
Yards per Point Offense91145.0%81240.0%PHI
Yards per Point Defense111052.4%111052.4%KC
Yards Per Point Diff13861.9%111052.4%KC
Red Zone TD Pct Offense111052.4%111052.4%PHI
Red Zone TD Pct Defense12957.1%81338.1%PHI
Third Down Conversion % Offense111052.4%91242.9%KC
Third Down Conversion % Defense91242.9%91242.9%PHI
% of First Downs on Offense via Pass12957.1%12957.1%KC
% of First Downs Allowed by Rush81240.0%71335.0%KC
Interception Rate on Def12957.1%81338.1%PHI
Interception Rate on Offense91145.0%11955.0%PHI
FG % Made15671.4%13861.9%KC
FG % Made Against101147.6%14766.7%KC
Net Punt Average81142.1%81142.1%PHI
Touchback Percentage91242.9%111052.4%KC
4th Down Conversion Rate91047.4%91047.4%KC
  • Yards per point on offense and defense measure how good a team is at converting or preventing points based on the yards gained or allowed. However, they are interrelated. A team that scores more points than the yards suggest might do so because of great defense and special teams setting the offense up with shorter fields. Conversely, a team that allows fewer points than you would expect based on yards might benefit from an efficient offense that forces opponents to gain more to score.
  • Interestingly, teams that give up a lower percentage of first downs via rushes (because they tend to have a relatively better rushing defense than passing defense) and teams that have been better at stopping touchdowns in the red zone (which likely correlates to stopping the run in short-yardage situations) have fared poorly against the spread in the Super Bowl. Subject to the limited-sample-size caveat, these teams likely faced better quarterbacks in the Super Bowl than they did on average during the regular season, and better quarterbacks probably render stout run defenses less important.

2025 Analysis: The biggest statistical differences come in third down conversion rate on offense, and percentage of first downs coming by pass. Despite the lower overall rate stats in the passing game this year for Patrick Mahomes, third down is where he shined, as the Chiefs converted 48% of all third downs, and 63% of all first downs came via the pass. Philadelphia, meanwhile, had the lowest percentage of first downs coming by the pass in the entire NFL, at 47%.

Meanwhile, Philadelphia was better in the offensive red zone at converting touchdowns (hello, Tush Push), as they were at 57% of all red zone trips ending in a touchdown (54% for Kansas City). Philadelphia’s strong pass defense numbers also show up on third down, where opponents only converted 36%, so this game will feature strength on strength in Mahomes against the Eagles D on third down.